What I want to represent
Let's assume I have several schemas of the following kind:
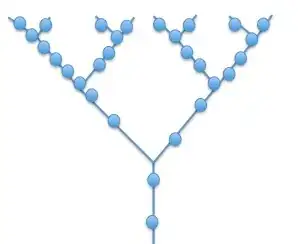
It is a tree on which positions of squirrels are represented by a blue dot. The number of bifurcations differ from one tree to another, the number of squirrels varies from one tree to another, the positions of the squirrels vary (and are on a continuous scale), all trees are not necessarily symmetric (unlike the picture) and the length of the branches differ (on the picture the length of the second branches are all the same, the lengths of the third branches are all the same. This is not necessarily always the case).
The problem
I am trying to describe these trees with numbers so that I can play with these numbers and easily calculate the distance between two squirrels (following the branches, not by jumping), calculate the distance between a squirrel and the ground (the bottom of the trunk) or calculate the density of squirrels per branch.
The angles between branches do not matter and the branches have no width (they are just lines). The info I need are the length of the branches (on a continuous scale), the positions of the squirrels (on a continuous scale) relative to their branch, the number of bifurcations and the positions of the branches relative to other branches (whether one branch is attached to another one).
My (very) poor solutions
One way to describe this tree is to digitalize it. I could make a big array with 0s everywhere there is nothing, 1s everywhere there is a branch and a 2 everywhere there is a squirrel (and a branch necessarily, no flying squirrel on the picture!). That would be a solution but I would very big arrays and it is really not very handy to infer things like the average distance between two squirrels. Moreover, we lose precision about the positions of the squirrels and the lengths of the branches
Another solution would be to have two sets of vectors and one set of points. The first set of vector describes the positions of each squirrel relative to the bottom-left corner, another set of vector defines the the length and direction (although we don't directly need this info) of each branch and the set of points indicate where the starting points of the vectors describing the branches. It really doesn't seem to be a good idea; it is too descriptive (too much info) and is not very handy for making the kind of calculations I need to perform afterward.
I feel like I focus too much on the picture and have a hard time realizing how the informations I need could be coded/stored. Can you help me with that?