3

I'm having difficulties understanding whether or not this is the right process to use for a flow chart which illustrates the processes involved in an algorithm.

For this, assume the following:

A 1D X = [0, 1, 2, 3,........] data block is split into 2D blocks:

x = {[0 1]} 
    {[2 3]}

For each of these blocks, the total energy is counted, if the total energy is less than the threshold value the block is removed. If the energy is higher, then it is kept and the algorithm moves onto the next block.

Here's my flow-chart:

enter image description here

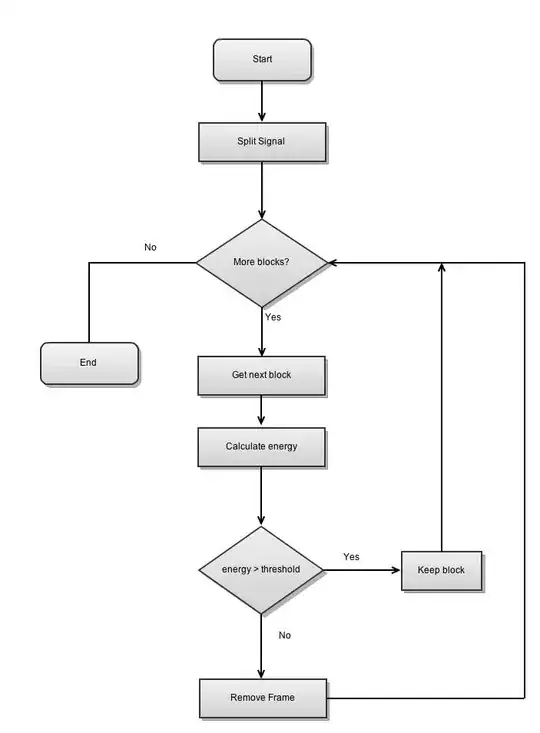
Now the way I look at this is that, I start the algorithm split the signal into frames, calculate the energy for each signal (2D) if the energy < theshold remove the frame AND THEN end the algorithm.

If the energy is higher than the threshold, then, it looks that the signal block (2D) is passed back into the algorithm, the energy for the signal is re-calculated.

My questions:-

1) Should there be a while loop that says "If at the end of the block"?

2) Should I specify that blocks of x[n][n] could be passed into the calculate energy?

Alternatively, does this look fine and I should apply some description of how the process works in written text?

Any help would be greatly appreciated :)

Doc Brown
  • 199,015
  • 33
  • 367
  • 565
Phorce
  • 209
  • 1
  • 5
  • 9
  • Would you please clarify the difference between a "frame" and a "block"? – John R. Strohm Mar 05 '13 at 16:14
  • @Phorce: Did you just edit your question to make your flow chart match Dave's answer? That's very confusing. – Brian Mar 05 '13 at 21:03
  • @Brain Yes, I did. My apologies for not making it clear. I thought that, the thread had lost interest and I accepted Dave's answer and instead of over-populating the question with multiple diagrams, I should just ask the specific one. Once again, accept my apologies for not pointing it out. – Phorce Mar 05 '13 at 21:36
  • 1
    @Phorce: Generally, you should *not* edit your question to make it match an answer. Future users who read your question will be very confused. – Brian Mar 06 '13 at 14:52

1 Answers1

2

Is the algorithm done once you remove one block that does not meet the threshold? If not, you need a loop that iterates over each block. You also need an exit condition if you have no blocks that fail to meet the threshold. Maybe something like this?

         Start
          |
          V
         Split signal
          |
          V
 /------ More blocks? <----\  <----\
 | (n)    |(y)             |       |
 V        V                |       |
End      Get next block    |       |
          |                |       |
          V                |       |
         Calculate         |       |
          |                |       |
          V                |       |
         Meets threshold? -/ (y)   |
          | (n)                    |
          V                        |
         Remove frame -------------/

Note, I don't normally do flow charts for my day-to-day activities so forgive me if I'm off base here.

Dave Rager
  • 874
  • 6
  • 9
  • Thank you for your reply. Could you please check my updated flow chart (in my o/p) and tell me if this looks a lot better now. Thank you – Phorce Mar 05 '13 at 15:43
  • It looks more correct to me. I can see each block/frame being processed without exiting prematurely. As @JohnR says in his comment though, there could be a better distinction between what a block and a frame is (if they are not the same thing). – Dave Rager Mar 05 '13 at 16:25
  • Thank you for the advice. Should I include a caption of text that tells the reader that a "Frame" is the same as a "Block"? – Phorce Mar 05 '13 at 16:55
  • I would use consistent naming throughout. If a "frame" is more descriptive of what the data is I'd call it "frame" and forget the term "block" ever existed. – Dave Rager Mar 05 '13 at 17:10