2

We have cisco nexus 9396PX with N9K-M12PQ module (12x40G Interface), We have 8x10G L3 LACP bonded connectivity with our ISP and so far so good no issue at all. but recently we migrated that LACP LAg to 3x40G link ( so total 120Gbps link)

As soon as we moved to 120G LACP i have started seeing output discard on all port-channel interface, Link utilization is 50Gbps during peak but average is 30Gbps around that means its not link congestion issue i have plenty of available bandwidth. I have thought of micro burst but again why it started after migrating to 40G interface, last 1 year there was no issue on 8x10G LACP LAg?

N9K# sh int po120
port-channel120 is up
admin state is up,
  Hardware: Port-Channel, address: 88f0.31db.e5d7 (bia 6412.25ed.9047)
  Description: 120G_L3_LACP
  Internet Address is 77.211.14.XX/30
  MTU 1500 bytes, BW 120000000 Kbit, DLY 10 usec
  reliability 255/255, txload 55/255, rxload 48/255
  Encapsulation ARPA, medium is broadcast
  full-duplex, 40 Gb/s
  Input flow-control is off, output flow-control is off
  Auto-mdix is turned off
  Switchport monitor is off
  EtherType is 0x8100
  Members in this channel: Eth2/1, Eth2/2, Eth2/3
  Last clearing of "show interface" counters never
  1 interface resets
  30 seconds input rate 22940013928 bits/sec, 22332504 packets/sec
  30 seconds output rate 25888954296 bits/sec, 17780437 packets/sec
  Load-Interval #2: 5 minute (300 seconds)
    input rate 22.86 Gbps, 22.26 Mpps; output rate 25.75 Gbps, 17.69 Mpps
  RX
    6291392826509 unicast packets  24502 multicast packets  84 broadcast packets
    6291392850755 input packets  876101389840965 bytes
    0 jumbo packets  0 storm suppression packets
    0 runts  0 giants  0 CRC  0 no buffer
    0 input error  0 short frame  0 overrun   0 underrun  0 ignored
    0 watchdog  0 bad etype drop  0 bad proto drop  0 if down drop
    0 input with dribble  0 input discard
    0 Rx pause
  TX
    6308927523402 unicast packets  732947 multicast packets  2 broadcast packets
    6308928256067 output packets  1158946502837217 bytes
    2 jumbo packets
    0 output error  0 collision  0 deferred  0 late collision
    0 lost carrier  0 no carrier  0 babble  11275 output discard
    0 Tx pause

Policy-map

N9K# show policy-map interface e2/1


Global statistics status :   enabled

Ethernet2/1

  Service-policy (queuing) output:   default-out-policy

    Class-map (queuing):   c-out-q3 (match-any)
      priority level 1
      queue dropped pkts : 0
      queue depth in bytes : 0

    Class-map (queuing):   c-out-q2 (match-any)
      bandwidth remaining percent 0
      queue dropped pkts : 0
      queue depth in bytes : 0

    Class-map (queuing):   c-out-q1 (match-any)
      bandwidth remaining percent 0
      queue dropped pkts : 0
      queue depth in bytes : 0

    Class-map (queuing):   c-out-q-default (match-any)
      bandwidth remaining percent 100
      queue dropped pkts : 3795
      queue depth in bytes : 0

Buffer profile

N9K# show hardware qos ns-buffer-profile
NS Buffer Profile: Burst optimized

Queue interface

N9K# show queuing interface e2/1

slot  1
=======


Egress Queuing for Ethernet2/1 [System]
------------------------------------------------------------------------------
QoS-Group# Bandwidth% PrioLevel                Shape                   QLimit
                                   Min          Max        Units
------------------------------------------------------------------------------
      3             -         1           -            -     -            6(D)
      2             0         -           -            -     -            6(D)
      1             0         -           -            -     -            6(D)
      0           100         -           -            -     -            6(D)

Port Egress Statistics
--------------------------------------------------------
Pause Flush Drop Pkts                              0

+-------------------------------------------------------------------+
|                              QOS GROUP 0                          |
+-------------------------------------------------------------------+
|        Tx Pkts |   2096313003372|   Dropped Pkts |            3795|
+-------------------------------------------------------------------+
|                              QOS GROUP 1                          |
+-------------------------------------------------------------------+
|        Tx Pkts |               0|   Dropped Pkts |               0|
+-------------------------------------------------------------------+
|                              QOS GROUP 2                          |
+-------------------------------------------------------------------+
|        Tx Pkts |               0|   Dropped Pkts |               0|
+-------------------------------------------------------------------+
|                              QOS GROUP 3                          |
+-------------------------------------------------------------------+
|        Tx Pkts |               0|   Dropped Pkts |               0|
+-------------------------------------------------------------------+
|                      CONTROL QOS GROUP 4                          |
+-------------------------------------------------------------------+
|        Tx Pkts |       291929094|   Dropped Pkts |               0|
+-------------------------------------------------------------------+
|                         SPAN QOS GROUP 5                          |
+-------------------------------------------------------------------+
|        Tx Pkts |               0|   Dropped Pkts |               0|
+-------------------------------------------------------------------+


Ingress Queuing for Ethernet2/1
------------------------------------------------------------------
QoS-Group#                 Pause                        QLimit
           Buff Size       Pause Th      Resume Th
------------------------------------------------------------------
      3              -            -            -           10(D)
      2              -            -            -           10(D)
      1              -            -            -           10(D)
      0              -            -            -           10(D)

PFC Statistics
----------------------------------------------------------------------------
TxPPP:                    0, RxPPP:                    0
----------------------------------------------------------------------------
 COS QOS Group        PG   TxPause   TxCount         RxPause         RxCount
   0         0         -  Inactive         0        Inactive               0
   1         0         -  Inactive         0        Inactive               0
   2         0         -  Inactive         0        Inactive               0
   3         0         -  Inactive         0        Inactive               0
   4         0         -  Inactive         0        Inactive               0
   5         0         -  Inactive         0        Inactive               0
   6         0         -  Inactive         0        Inactive               0
   7         0         -  Inactive         0        Inactive               0
----------------------------------------------------------------------------

Queuing stats

N9K# show system internal qos queuing stats interface e2/1
Interface Ethernet2/1 statistics
Receive queues
----------------------------------------
This is not yet implemented
Interface Ethernet2/1 statistics
Transmit queues
----------------------------------------
This is not yet implemented

Upate - 1

Port-channel load-balancing is src-dst ip-l4port

Port Channel Load-Balancing Configuration for all modules:
Module 1:
  Non-IP: src-dst mac
  IP: src-dst ip-l4port rotate 0

I can see all 3 links sharing balance traffic i am not seeing any disparity there.
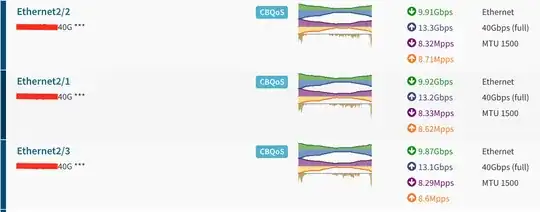
enter image description here

Satish
  • 4,361
  • 12
  • 67
  • 120
  • The way Cisco hashing works, you really want the number of interfaces in the LAG to be a power of two (2, 4, or 8). – Ron Maupin May 20 '19 at 17:27
  • What type of load-balancing are you running on your LACP links? It could help, but as stated by Zac, output drops is typically caused by small bursty traffic, which you cannot see over long periods of time. – Cow May 20 '19 at 17:29
  • I have updated my question with more info, related microburst theory, why it didn't happen when it was running on 8x10G LAg but as soon as we moved to 3x40G suddenly microburst came in picture.. doesn't make sense.. – Satish May 20 '19 at 17:43
  • That is really even. Maybe you see bursting because the 40G port allows a single stream to utilize more traffic for short periods of time? I dunno. – Cow May 20 '19 at 17:56
  • I believe i can try to add 1 more 40G to existing LAg or configure `hardware qos ns-buffer-profile ultra-burst` option, is it safe to change buffer profile? – Satish May 20 '19 at 18:00
  • 11'275 output drops against 6'308'928'256'067? That's roughly 1 packet in 525 million packets. You may want to do a "clear counters" on the said interface to get a grasp of how many drops there actually are for a given period. – Marc 'netztier' Luethi May 20 '19 at 19:50
  • I did clears and drops are very low not repid drops, after clear counter `639919908 output packets` and got `1` drops, again there was `zero` drop earlier in last 1 year, now i am seeing even 1 drops making me uncomfortable – Satish May 20 '19 at 20:05
  • @RonMaupin, I strongly disagree with the "power of two" recommendation on LAGs. I see it far to often but it has very little basis in actual numbers. Just because traffic is unbalanced, doesn't make it less desirable. See [my answer here](https://networkengineering.stackexchange.com/a/13376/33) for more. Not to mention this is only with older LAG hashing and most newer platforms have extended the size of the hash value. – YLearn May 20 '19 at 20:06
  • @YLearn, that is still what Cisco recommends to us. It's not that other values do not work, but having a power of two optimizes the algorithm balancing traffic across the channel members. – Ron Maupin May 20 '19 at 20:11
  • @RonMaupin, Cisco also recommends by default that you should run LAG to an access point with multiple interfaces for the extra bandwidth when all traffic is tunneled back to the controller (which no matter how you hash it results in only one link being used). However in my experience, whenever I challenge either that assertion or the "power of two" with actual information, they back off that particular recommendation. – YLearn May 20 '19 at 20:13
  • @Satish `now i am seeing even 1 drops making me uncomfortable` ... because 1 in 640 Million, thats 0.0016ppm? It's a packet switched world, running on Ethernet. Get used to it. TCP can handle this, it's been built, tuned and honed many times for _exactly_ this purpose. If there's (usually UDP based) traffic classes that must be protected as much as possible from drops, set up QoS. – Marc 'netztier' Luethi May 21 '19 at 05:36
  • @Satish be sure to include the drop counters in your monitoring solution, and observe them over time. As long as these counters don't start "running away", but their graph stays "flat" at the current rate, I just wouldn't bother. – Marc 'netztier' Luethi May 21 '19 at 05:48
  • Did any answer help you? If so, you should accept the answer so that the question doesn't keep popping up forever, looking for an answer. Alternatively, you can provide and accept your own answer. – Ron Maupin Dec 15 '19 at 03:12

1 Answers1

3

Link utilization is 50Gbps during peak

This might be the problem. A LAG trunk only features the aggregated bandwidth of its interfaces when traffic distribution across the port group is perfect. With three ports in the trunk group, distribution differs significantly from the previous eight interfaces.

Usually, source/destination IP addresses/L4 port numbers are hashed and the hash is used to index the egress port - with three ports and completely random IP addresses/ports, chances are that two ports get half the traffic (a quarter each) while the third gets the other half. (Or rather, the probability for a packet to exit ports A and B is 25% each and 50% for port C).

Since in reality the IP/port distribution is not random and often you've got a small numbers of very fast flows, it is possible that the combination of flows exceed the egress interface's bandwidth. You need to monitor the flows and each interface's throughput closely to pinpoint the exact cause and figure out how to avoid.

Zac67
  • 81,287
  • 3
  • 67
  • 131
  • i have updated my question with more info, i am seeing traffic equally sharing on all 3 links. – Satish May 20 '19 at 17:43
  • @Satish Well, there goes my theory - does in fact look extremely even... – Zac67 May 20 '19 at 17:47
  • 2
    @Zac67, according to [Cisco documentation](https://www.cisco.com/c/en/us/support/docs/lan-switching/etherchannel/12023-4.html) (among other sources), the hashing in a 3 port LAG is 37.5/37.5/25 and not 25/25/50 as you state. – YLearn May 20 '19 at 20:12
  • @Satish The exact methods differ, but they're always uneven when the number of ports isn't a power of two. – Zac67 May 20 '19 at 20:28