is there any program which I can use to draw waveforms for digital encoding schemes such as biopolar-alternate mark inversion, manchester, b8zs and hdb3?
Asked
Active
Viewed 4,523 times
0
-
Duplicate of http://electronics.stackexchange.com/questions/3564/software-to-create-timing-diagrams/3591#3591 – shuckc Feb 11 '14 at 17:50
-
It's related, but I don't agree it's a duplicate of that one. Although one or two of the programs mentioned in that thread can be used to draw simple waveforms, and timing diagrams, it is different enough from drawing encoded data like this that it warrants its own post. – Brian Onn Feb 11 '14 at 17:59
-
This is a useful question and answer for Engineers; the original poster wanted to know how to draw waveforms for communications encoding schemes and I presented an answer using Matlab.. I don't think it's off-topic, and I don't think the answer I gave will be "rarely useful" nor "obsolete". Can the moderators reopen this question so more people can see it.. I think my answer is truly helpful using a tool that most electrical engineers use daily. – Brian Onn Feb 13 '14 at 13:46
3 Answers
2
Wavedrom is a good online tool for this, failing that LibreOffice Calc or Excel with cell borders can get the job done laboriously.
-
This is the answer I personally was looking for. I hope it helps other people too. – HL-SDK Feb 11 '14 at 18:15
1
I recommend Matlab for this.
If you have Matlab or you are a student and can get a lower cost student version, then you can use it to do all your encodings and plot them.
You will need to learn the Matlab programming language though, but it's a really simple language to learn.
If you google around, you can find examples that other people may have already done. For example, here's a link to the Matlab code for manchester encoding:
http://www.mathworks.co.uk/matlabcentral/fileexchange/23203-standard-logic-to-manchester-encoder
This example is just a transfer function, but Matlab can plot the result for you in just a few more lines of code.
For a free version, there is also GNU Octave, which is a near 100% compatible clone to Matlab. There are GUI's for GNU Octave too, to make it look similar to the Matlab UI.
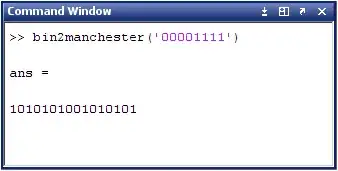
Here's what it looks like in GNU Octave:
octave:6> bin2manchester('00001111')
ans = 1010101001010101
octave:7>
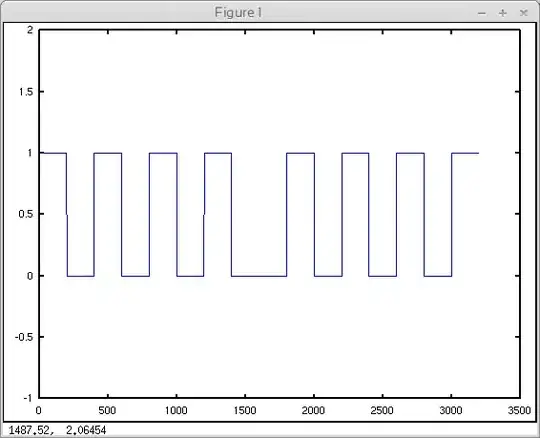
EDIT: Ok, here's the plot
octave:16> a = '00001111'
octave:17> b = bin2manchester(a)
octave:18> c = b-'0'
octave:19> A = reshape(repmat(reshape(c',1,[]),200,1),[],size(c,1))'
octave:20> axis([0 3500 -1 2])
octave:21> plot(A)
Brian Onn
- 1,342
- 7
- 9
-
ok, I added the extra matlab code for the plot, thanks for the 1 back :) I thought the answer was pretty useful even without me writing the full code. – Brian Onn Feb 11 '14 at 17:51
-
Hi Brian, Thanks for the answer. I have downloaded Octave. Just a few questions: I tried type bin2manchester('00001111') but it returned error: 'bin2manchester' undefined near line 1 column 5
Do I need to download additional module for it to works? – Withhelds Feb 13 '14 at 16:27 -
yes, bin2manchester is a function at the webpage I linked to in the 4th paragraph above. Download the bin2manchester.m function. At the Octave prompt type 'path' and return, you will see the function load path. Put that bin2manchester.m file in one of the paths so it can be found as a loadable function. – Brian Onn Feb 13 '14 at 17:13
-
You should edit your question so it can be reviewed and possibly not get deleted :) if you re-word it more specifically then the mods will see it and possibly take it off hold. Q's on hold for 5 days are deleted. – Brian Onn Feb 13 '14 at 17:15
0
You could try Inkscape, which is a free vector drawing program, decent user community and perhaps some relevant extensions (eg. nicecharts).
Could be used to work with vector plots exported from MATLAB, Scilab, OO Draw, Octave etc.
Spehro Pefhany
- 376,485
- 21
- 320
- 842