No.
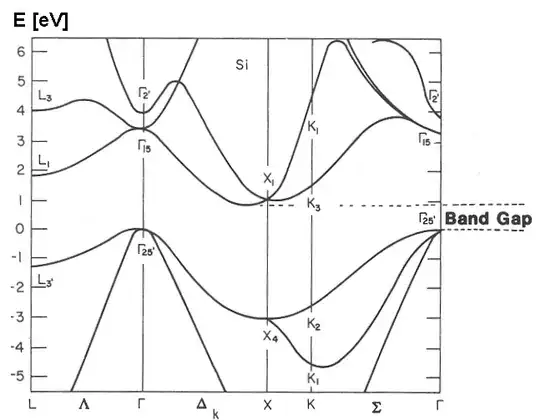
First of all, the diagram you're referring to is very complex: it incorporates information about band structures along different crystal directions.
For simplicity of explanation, let us restrict ourselves to a single crystal direction - (100). Along this direction, the band structure of silicon looks like this:
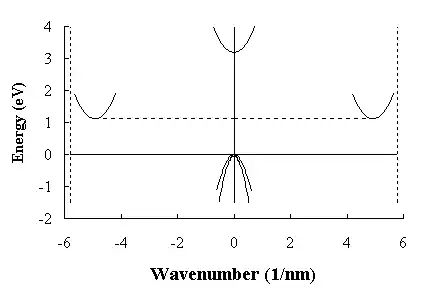
You can see that valence band is split into two lines, having different slopes. What is the meaning of these lines? It is really a bit complex to explain without you having some background in SC physics (I assume you do not have much of it, right?), but I'll try to provide some intuitive analogy.
Note that \$y\$ axis is energy, while \$x\$ axis is momentum (it is labeled as "wavenumber", but there is a linear relation between the two). You can interpret the boundary of the valence band as showing what is the maximal change in hole's momentum, when it gains a particular amount of energy. In other words (recalling that momentum and velocity are related): given that the hole gains some energy, how much will its velocity change.
It should be clear (from visual inspection of the graph) that the lower the slope of the valence band edge, the bigger a change in momentum of a hole for some given change in its energy. In other words - the holes are easier to gain a momentum when valence band edge has lower slope.
Now, assuming that hole is a classical particle, the energy it can gain is kinetic energy. The relation between kinetic energy and momentum is:
$$E_K=\frac {p^2}{2m}$$
We said before that the lower the slope of the valence band's edge, the higher the momentum a hole gains when energy changes. Interpreting this fact in terms of the above equation means that the mass of the hole reduces with reduction in slope of the valence band edge. Therefore, the slope of the band edge represents the mass of the hole.
When there are few lines having the same (or very close) maxima, it simply means that there are few types of holes in the material - some of them "lighter" than others. In the diagram above, where there are two lines in valence band, which means that there are two types of holes: light holes (LH) which correspond to the line with lower slope, and heavy holes (HH) which correspond to the more steep parabola.
The above is not a rigorously correct answer, but it should provide enough intuition in order to understand what the amount of lines represents. I hope it helps.