Opamp manufacturers post graphs like these in datasheets:
How is the data for this graph measured? Is it calculated using the mathematical model of an opamp?
Opamp manufacturers post graphs like these in datasheets:
How is the data for this graph measured? Is it calculated using the mathematical model of an opamp?
The trick to measuring open loop gain and phase for an op-amp is getting the dc conditions just right. If this isn't done correctly the output amplitude can drift off to any dc value and clip the signal thus making the measurement invalid.
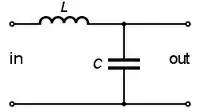
So, in order to do this one method is to apply dc-only negative feedback of a small amount so that the output voltage stays roughly mid-rail (with the "real" signal superimposed on top). The effect of applying dc-only feedback invalidates (to a certain extent) the low frequency response but this isn't a problem because most of the "interesting stuff" occurs above 10Hz or 100Hz (dependent on the op-amp you are using).
The output signal will contain a fair amount of distortion but this can be filtered, usually with a spectrum analyser or a computer using fourrier transforms. This allows the fundamental frequency to be measured in amplitude.
The same sort of filtering is applied to the input in order to determine phase relationships between input and output. Thus input and output are "delayed" the same amount allowing accurate phase measurements to be undertaken.
The methods described above are just a simplified form of the techniques used and doesn't imply that all manufacturers use the same technique.
It's measured, with test equipment, like a network analyzer. Usually the datasheets have some circuits that were used, such as this from TL072: