9

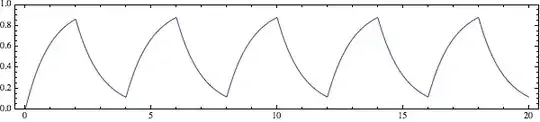
I found the following image on electronics-tutorials.ws:

enter image description here

Isn't this wrong? Shouldn't the voltage rise faster during the first 2T than that it decreases during the next half period? I think so because the voltage difference at t=0 is Vc, which is higher than the voltage difference at t=2T. Shouldn't the triangle wave ultimately go halfway Vc(max), with difference distributed evenly below and above the curve?
(I hope I make myself clear.)

Kaz
  • 19,838
  • 1
  • 39
  • 82
flup
  • 902
  • 7
  • 14

3 Answers3

6

Yes, it actually looks like this (doing a numerical integration of the differential equation):

sawtooth ending up between about 0.12 and 0.88

At equilibrium, the peaks of the sawtooth are at \${1\over 1+e^{T\over 2RC}}V_S\$ and \${e^{T\over 2RC}\over 1+e^{T\over 2RC}}V_S\$, where \$T\$ is the period of the square wave (different from the \$T\$ in the question plot). For this example, that's about \$0.12V_S\$ to \$0.88V_S\$.

In that case equilibrium is reached very fast. For a higher frequency square wave, it can take a few cycles. In this example, the period of the square wave is \$RC\over 2\$ instead of \$4RC\$:

slower rise for higher frequency

Mark Adler
  • 226
  • 2
  • 5
  • Thanks. Just a nag: can't Mathematica do the DE analytically? :-) – flup Dec 15 '13 at 08:21
  • Yes it certainly can, but that would take more care and feeding. Doing it numerically with `NDSolve[]` was just one line. Took about 30 seconds to type in, boom, done. Then another line for the plot. I did then solve analytically for the equilibrium peaks, though I didn't use `DSolve[]` since I already knew the equations. – Mark Adler Dec 15 '13 at 08:34
  • Small request: could you make the vertical scale from 0 to 1 in the second graph too? It better shows the symmetry. – amadeus Dec 15 '13 at 08:46
5

Like Wouter says the discharge voltage should be negative to get this curve. More precisely it should be -difference V. So indeed, like you surmised the curve will end up halfway the charge and discharge voltages. Note that at t = 0 it will start from V = 0V, and over a few cycles move up.

amadeus
  • 1,010
  • 7
  • 16
  • Actually it gets to equilibrium very fast. It's extremely close within one cycle. The first peak is within 2% of the equlibrium peak, and the first trough is within 2% as well. The next peak and trough are within 0.03%. – Mark Adler Dec 15 '13 at 01:24
  • @MarkAdler: you're right that in this case equilibrium is reached fast, but I was thinking in more general terms. If the signal's period is much shorter than RC then it may take several cycles. – amadeus Dec 15 '13 at 08:36
  • Yes, it will. I'll add an example of that to my answer. – Mark Adler Dec 15 '13 at 08:41
3

You are right. The curve as shown requires that the discharge voltage is negative.

Wouter van Ooijen
  • 48,407
  • 1
  • 63
  • 136