7

I've been reading about the I-V curve - or power curve - of solar panels and photovoltaic cells and how exposure to light, heat, load, etc. affects the ratio (?) between current and voltage in a non-linear manner.

Does the sort of synchronous permanent magnet generator that is used in wind turbines also have some sort of non-linear power curve when I-V output is plotted across e.g. different wind speeds?

For this question, I'm referring to a DC rectified output rather than 3 phase AC output (if that makes any difference to the answer).

The wind turbine data sheets I've seen so far all seem to plot wind/rpm against power/watts with a curve that suggests 'the faster it spins, the more power it outputs' (excluding self-destruct speeds obviously!) - but I'd be curious to hear an answer based on the relationship between I-V as a comparison to solar panels.

robobozo
  • 451
  • 1
  • 11
  • A generator might be 90% energy efficient whereas a solar panel might be only 20% and, that makes comparisons not as useful. – Andy aka May 22 '23 at 12:50
  • 2
    If you have a synchronous PM generator, the I-V curve I implied to you in your other question is wrong. I thought you had a true DC generator. You still have an I-V-(f) curve for a synchronous PM generator and an MPPT problem to solve, the curve just looks different. – winny May 22 '23 at 13:17
  • 1
    For any particular windspeed, yes. Load it too heavily for that windspeed, and you will stall the blades and get less power. –  May 22 '23 at 13:17
  • ©user_1818839 and then change the pitch of the blades... – Solar Mike May 22 '23 at 13:30
  • @winny I believe the little 12V PMG I have here that I've been basing my questions on is synchronous - i.e. it outputs 3 phase AC and the faster you spin it, the larger the peak to peak voltage of the output waveforms. All my 'how to combine this with a solar panel' questions are based on DC rectifying that output before 'summing' them. Your comment about the MPPT problem is noted. Thanks! – robobozo May 22 '23 at 14:21
  • 1
    MPPT for solar is widely available. MPPT for small wind is less common, so I both forsee and recommend you make your own with an Arduino or similar. – winny May 22 '23 at 15:05
  • 1
    @winny - Yes - I think that's where this will end up but I want to try and take smallest possible steps to get there to make sure I understand the fundamentals and my own requirements. Thanks agin - appreciated. – robobozo May 22 '23 at 15:23

1 Answers1

9

Yes, every generator has an IV curve. For ideal current or voltage sources it looks like this: enter image description here 
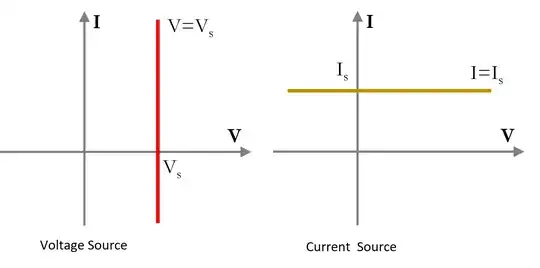
Source: Modified from here: https://www.allaboutcircuits.com/technical-articles/understanding-i-v-curves-part-i/

Does the sort of synchronous permanent magnet generator that is used in wind turbines also have some sort of non-linear power curve when I-V output is plotted across e.g. different wind speeds?

It really depends on the motor, most motors are linear. The main problem is the wind power input is noninear as the mechanical power is the velocity of the wind cubed and then also related to the efficiency of the blades.

Wind has a mechanical power output, which has an optimal power point, and similar to solar power has a peak power point. If you think about worst case, if you have no electrical load the motor will spin very fast. If you put so much electrical load that you exceed the torque of what the wind can provide the motor will stop and there will be zero power output. The optimal point is somewhere in between and if you want to get optimal power, you'll need an MPPT on the load to get optimal power output.

This is a graph for a turbines mechanical wind power output, you'll need to stay at the optimal power point to get out the most power marked nominal power. This is different for every wind generator, but if you want to take a shortcut you don't need to know what the point is, just use a load with MPPT and the algorithm will find the nominal load at the optimal power point. One thing to consider is solar MPPT update cycles don't need to be as much as wind, becuse the wind changes much faster than the sourcing power of a PV system enter image description here Source: https://www.mdpi.com/1996-1073/12/20/3938

This graph shows the actual IV measurements and theoretical curves for a wind turbine. These curves look a lot different than a solar panel.

enter image description here Source: https://www.researchgate.net/figure/Voltage-current-curves-From-the-data-used-in-this-figure-we-can-plot-another-one-Power_fig5_229044823

Voltage Spike
  • 75,799
  • 36
  • 80
  • 208
  • This feels like a very much like the answer I wrote recently, that was "I don't know much about wind turbines but here are some graphs I found on the Internet" (I notice you used one of the exact same graphs), except you wrote it to appear more confidently. Can you confirm this is your actual experience with how wind turbines actually behave? – user253751 May 22 '23 at 15:40
  • 1
    I actually don't have much experience with operating them, but I have a lot of experience with MPPT algorithms and have built them and understand IV curves and how to do this with a wind turbine. I have done a lot of research into building a wind turbine as a hobby but never did because the cost was too great. The OP wanted to know what an IV curve for a wind turbine looked like, that is the bottom graph. – Voltage Spike May 22 '23 at 15:46
  • yeah but the bottom graph is for constant rotor speed. The real rotor speed isn't constant because it depends on how much you load the generator. The penultimate also uses rotor speed on the X axis. What's actually wanted is I/V for a fixed wind speed, not rotor speed. – user253751 May 22 '23 at 15:47
  • And that's what the second graph is for, to explain that, the most important thing to understand with wind generation is it's not constant an you need an MPPT. The MPPT makes up for a lot – Voltage Spike May 22 '23 at 15:47
  • The penultimate graph shows MW/rpm for a fixed wind speed which doesn't seem useful from an electrical perspective? – user253751 May 22 '23 at 15:48
  • 1
    The last graph shows it for multiple RPM's which would vary with wind speed. – Voltage Spike May 22 '23 at 15:49
  • but the rpm also varies depending on the current – user253751 May 22 '23 at 15:50
  • 5
    Right, if you wanted to actually come up with a plot, you would have to have a 5 dimensional plot with voltage, current, torque, motor speed and torque. and we can only plot 3 dimensions, and people only like to see two. Most graphs will show a piece of the system not the system as a whole, so you'll never get a graph with voltage current windspeed and torque. you have to understand the system in pieces. The main thing that matters to a generator is how much power you put in, and you run the motor at it's optimal load. – Voltage Spike May 22 '23 at 15:53
  • The dimensions we are supposed to see here are electrical current, and electrical voltage, for a fixed wind speed, without caring about torque nor motor speed. The five dimensions do not vary independently. This is not a difficult requirement and your answer does not fulfil it. Please stop trying to make it difficult. – user253751 May 22 '23 at 15:54
  • 1
    I could not find an example of that, if you find one feel free to update the question or write your own answer. I am not trying to make things difficult – Voltage Spike May 22 '23 at 15:55
  • 1
    If you do not have an example of what is needed for an answer you are expected to get one or to not answer instead of writing an answer using whatever you do have an example of. You do not search for your keys under the street lamp because the light is better there. Yes, I've been guilty of the same mistake in the past. Note that my similar answer was about "what happens when you connect power sources in parallel?" where knowing the I/V curve of a wind generator was not the main point, rather than "what is the I/V curve of a wind generator?" where you actually need an accurate one. – user253751 May 22 '23 at 15:56
  • 2
    I think there was always going to be some correlation in the answers to my previous question about how to connect different renewable energy sources - where one of the main issues seems to be combining different I-V curves - and this question specifically about the differences between the I-V curves of solar panels and synchronous PMGs. For where I'm at right now - even hearing multiple variations of the same answer a couple of times from different people delivered in different ways is a help for me. – robobozo May 22 '23 at 16:22