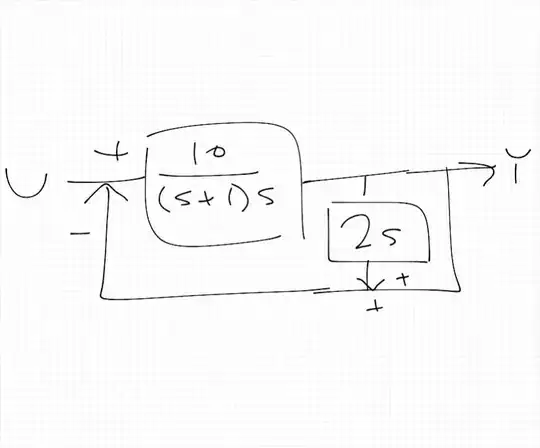
To understand this, consider the open loop gain plot and the 1/beta plots as separate plots on the same frequency/magnitude plot.
I expect you are familiar with the typical shape of the open loop gain plot and then add to this the horizontal plot of the 1/beta plot.
Now if we consider the 1/beta plot to be approximately equal to a closed loop gain plot bearing in mind that the closed loop gain plot will gradually reduce as frequency increases until it reaches the open loop gain plot where it will be -3 dB down and it will then follow the open loop gain plot downwards.
Now if we reduce beta (to improve stability) we are actually moving the 1/beta plot upwards on the graph and as a result the closed loop gain is also increasing.
This has the effect that the closed loop gain plot will meet the open loop gain plot at a lower frequency.
By reducing beta we have increased the closed loop gain, moving the closed loop pole down in frequency reducing bandwidth in the process.
