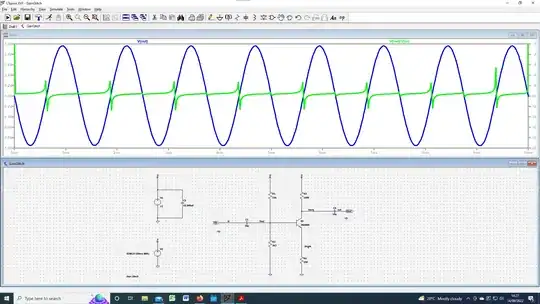
Screenshot shows a simple one BJT amplifier circuit in LTSpice, 100mV 800 Hz sinewave input with the output shown in the blue trace. The green trace shows the calculated voltage gain i.e. Vout/Vin. This averages about -10 which is what I would have expected. I can't explain the reason for the glitches in the gain in 2 places: where the Vout passes through zero volts on the way up and, to a lesser extent, on the way down. (Sorry: I just noticed the names on the wires which I should have removed! Please ignore)
Asked
Active
Viewed 87 times
0
-
2To plot the voltage gain use the AC analysis instead of a transient one. – G36 Sep 14 '22 at 14:35
-
1^ Also, if there is no load `C4` is useless. – a concerned citizen Sep 14 '22 at 14:44
-
1User, place a 10 Meg at the output just to provide a DC path. Also, increase your capacitor values by a factor of 33\$\times\$, let's say. See what happens then. – jonk Sep 15 '22 at 03:39
1 Answers
4
I can't explain the reason for the glitches in the gain in 2 places: where the Vout passes through zero volts on the way up and, to a lesser extent, on the way down.
The v(Vout) / v(Vin) relationship would be a straight line if the phase angle between them was bang-on 180° or bang-on 0°. But, because they can't be (maybe a fraction of a degree difference), you will have a potential X divided by 0 scenario and that will create these artefacts.
The node names are cool.
Andy aka
- 434,556
- 28
- 351
- 777
-
If you're looking for distortion, perform a FFT. You may need to turn off compression (Tools > Control Panel > Compression), set .options numdgt=7 plotwinsize=0, and perhaps decrease the step size in the .tran card. – qrk Sep 14 '22 at 16:14
-
-
