-1

Referring to the question I asked earlier, this is a perplexing thing which I noticed.

Here is a picture:

enter image description here The first plot (blue) is the I-V Shockley curve for D3, whereas the second one (green) is the voltage at the node connecting D3 to R3 v/s the voltage at the node connected to D3. The two plots are slightly different, probably in the slope of the exponential curve.

I have seen the Shockley equation for a diode before. Does this change occur due to the thermal voltage, which we assume to be 25.9mV at 300K? Is the depletion region of the diode responsible for this? An explanation would be really helpful.

Here is the circuit:

enter image description here

  • Where is R3? I don't see an R3 in either of the schematics on the linked post, and I don't see a difference in actual slope, aside from the fact that the Y axis bounds on the two plots don't exactly match up. I doubt that you can see an actual difference with the naked eye, and if you have a numerical analysis showing a difference, sharing it would be necessary. If this is the current sensing resistor voltage compared to the diode current, then Shockley Equation or not, KCL and Ohm's Law still hold, and your only difference is the voltage drop across the sense resistor (KVL also applies) – nanofarad Aug 18 '21 at 19:24
  • I don't read words and try and reconstruct schematics. Maybe someone else might. I'd like to suggest that you provide the full context for the curves so that they can be replicated, if desired. – jonk Aug 18 '21 at 19:24
  • The 'ideality factor' of a diode is rarely 1, so that will change things in detail – Neil_UK Aug 18 '21 at 19:25
  • I'm adding a pic – electrovolt Aug 18 '21 at 19:27
  • 2
    I still don't see a discernable difference in slope even if I try to zoom closely onto the image, because the differing axes and lack of grid lines make it hard to tell what's going on. Do you have numerical data to support the assertion that the slopes differ? – nanofarad Aug 18 '21 at 19:31
  • The equation I've used to check is I_d = I_s[exp(V_d/nV_t) - 1]. I've used this for different values of the voltage in x-axis to calculate a non-uniform slope for both the cases, and they are not the same. Also, zooming in the plots shows the difference in slopes between the two plots. – electrovolt Aug 18 '21 at 19:33
  • I can share the zoomed in pic, that might help. – electrovolt Aug 18 '21 at 19:34
  • @electrovolt That's NOT the entire Shockley equation. There is another one for Isat, itself. But how are you fitting the data? I have an algorithm that can generate the parameters given data points to do so. – jonk Aug 18 '21 at 19:37
  • Shouldn't a reverse bias(large) give the saturation current for the diode? I might be wrong. – electrovolt Aug 18 '21 at 19:40
  • @electrovolt Do you have a bulk Ohmic resistance in your model? You should. There are three parameters to develop: saturation current, emission coefficient, and the Ohmic resistance (amalgam of sources.) That's assuming a fixed temperature. – jonk Aug 18 '21 at 19:42
  • @electrovolt For example, Just use the 1N4148 diode from LTspice and use three currents: 10 uA, 1 mA, and 100 mA. Taking datapoints with some imprecision after an LTspice run I get: RS=0.568 Ohm, N=1.752, and ISAT=2.52E-9 Amp. When I look at the model LTspice uses -- those are the exact values they include, as well. You need to include resistance. – jonk Aug 18 '21 at 19:48
  • Yeah, I understand that. But I don't get why plotting the voltage v/s voltage differs slightly from the I-V curve, as these three parameters shouldn't have differed, according to me. – electrovolt Aug 18 '21 at 19:48
  • Ok, so am I missing out on the resistance when I am plotting the voltage between D3 and R3 v/s the voltage at the node connected to D3? – electrovolt Aug 18 '21 at 19:51
  • @electrovolt Just go look at the model for the 1N4148. It's right there. Including the resistance. It's called RS in the model. *Just go look*! Things match my expectations without difficulty. Then go pick another diode. And another one. And yet another one. Look at as many of them as you need. That resistance is "in series" in the diode model. You don't see it explicitly in the schematic, though. – jonk Aug 18 '21 at 19:54
  • 1) Clicking on the model in LTSpice only shows the avg forward current and breakdown voltage for me. 2) I checked other resources, and I found dynamic resistance calculations for the 1N4148 model after collecting data from I-V curves for different test cases. It was around 5 milli-Ohms. – electrovolt Aug 18 '21 at 20:13
  • Plot the two curves on the same scale if you want to convince us that they are different. Also, name your nodes. `V(n008)` tells me nothing about what voltage you were plotting. – The Photon Aug 18 '21 at 20:14
  • It's the node connected to the diode D3 from R3. I'm renaming it. – electrovolt Aug 18 '21 at 20:16
  • That D3_R3 node is just a current sensor of 1 Ohm so it must match the diode current. Right? – Tony Stewart EE75 Aug 18 '21 at 20:48
  • 2
    _"The two plots are slightly different, probably in the slope of the exponential curve."_ I combined both plots (from the 1916x855 original image) and the two curves were within 1 pixel of each other at all points. Any visible 'difference' is psychological. – Bruce Abbott Aug 18 '21 at 23:00

1 Answers1

2

Here's the 1N4148 model used by LTspice:

.model 1N4148 D(Is=2.52n Rs=.568 N=1.752 Cjo=4p M=.4 tt=20n Iave=200m Vpk=75 mfg=OnSemi type=silicon)

A diode model is really this:

schematic

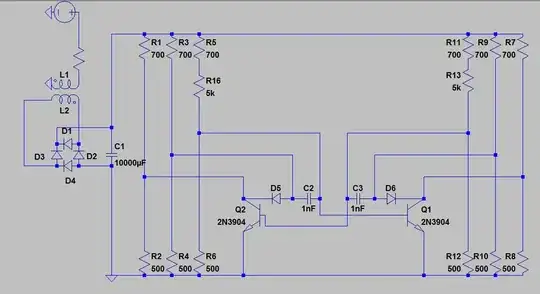
simulate this circuit – Schematic created using CircuitLab

Here's an LTspice schematic and results from a DC operating point run:

enter image description here

Here's me plugging in those values into some code I wrote that uses the series resistance and the Shockley diode model:

This program uses 3 diode measurements to extract parameters.
You will need to have taken these measurements beforehand.
Enter each point as [ <diode current>, <diode voltage> ].

Enter the ambient temperature in Celsius (default is 27 C):

Enter point 0: .00001 .375505
Enter point 1: .001   .58474
Enter point 2: .1     .849657
RS   = 0.568125701459042
N    = 1.75189696816123
ISAT = 2.51806283647115e-9

Compare above with the model LTspice used: Is=2.52n Rs=.568 N=1.752

Reduce the precision to just three digits for voltage:

This program uses 3 diode measurements to extract parameters.
You will need to have taken these measurements beforehand.
Enter each point as [ <diode current>, <diode voltage> ].

Enter the ambient temperature in Celsius (default is 27 C):

Enter point 0: .00001 .376
Enter point 1: .001   .585
Enter point 2: .1     .850
RS   = 0.571370268339972
N    = 1.74989707367668
ISAT = 2.46719846363323e-9

Compare again. Not bad.

Reduce the precision to just two digits for voltage:

This program uses 3 diode measurements to extract parameters.
You will need to have taken these measurements beforehand.
Enter each point as [ <diode current>, <diode voltage> ].

Enter the ambient temperature in Celsius (default is 27 C):

Enter point 0: .00001 .38
Enter point 1: .001   .59
Enter point 2: .1     .85
RS   = 0.510152025303548
N    = 1.75880132338524
ISAT = 2.35654795855193e-9

Still not all that terrible.

I'm not having any trouble with the above diode model or with matching LTspice results.

jonk
  • 77,059
  • 6
  • 73
  • 185