I know that I can integrate any value in a LTSPICE using CTRL+LEFT_MOUSE. But now I used .step param Y 0 10 1 to vary my input. And my aim was to get the energy consumed for different input, thus I need to integrate the product of current and Vdd. That is showing some error. Is there anyway to do it without changing the .step...?
-
Plot settings -> select trace. Or something similar. I can check the exact name when I’m in front of my computer. – winny Jul 09 '21 at 10:35
-
I generally do that , it will display the voltages and currents in the circuit. But when I use the .step param , no new node is named. Its like there is only one Vm(2) / Im(2) but when I plot it it will be multiple. I want to integrate it separately. @winny – Hari Krishna Jul 09 '21 at 10:40
-
If I remember correctly you can show only a single trace with the syntax V(y) @ x, change x with the number of the trace you want to plot (e.g. 1,2,3...), and V(y) with the node or current. – FedeWar Jul 09 '21 at 10:41
-
V(y) @ x ? didnt get that @FedeWar – Hari Krishna Jul 09 '21 at 10:45
-
Perhaps you can cheat around the problem with a .meas? – winny Jul 09 '21 at 10:50
-
The issue is they dont have separate variable name. So like if it take average of Id(M2) I guess it will be average of current for 10 different inputs for one full cycle ? I guess Idk how to call them separately. I just gave Vdd*(Is(M2)+Is(M6)) , and solution for all different inputs are plotted. .meas need to be used by calling the variable name right?in this case is that possible? @winny – Hari Krishna Jul 09 '21 at 10:53
-
If everything else fails, ngspice can for sure do it with a for-loop from console but it should be possible to create a loop in LTspice. Can you use @1, @2 and so on? – winny Jul 09 '21 at 10:56
-
I dont know what this '@' thing is @winny – Hari Krishna Jul 09 '21 at 10:58
-
Can't LTSpice plot energy into a node? – Andy aka Jul 09 '21 at 10:58
-
Yes I can integrate the voltage and current in LTSPICE to get the energy at a node. But when I am using the above mentioned function , there is only one node name for all different inputs. – Hari Krishna Jul 09 '21 at 11:03
-
@winny that unfortunately does not work. It still gives the same error message. – Arsenal Jul 09 '21 at 11:07
-
You could also try adding your own [integrator](https://electronics.stackexchange.com/q/254602/95619) and reading the values as voltages. – a concerned citizen Jul 10 '21 at 06:16
1 Answers
Sadly it is not possible with the graphical interface as it is.
What you can do to get around that limitation is use a .meas
statement to do the integration for you.
I have drawn a very simple example:
With this measurement statement:
.meas TRAN Energy INTEG V(n001)*I(R1) FROM 0 TO 1
LTSpice will compute the integral of the expression V(n001)*I(R1)
from 0 s to 1 s.
The results will be displayed in the SPICE Error Log (under view).
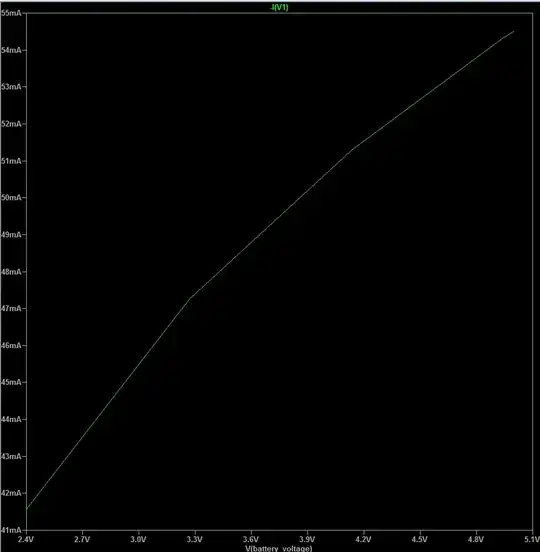
With a right click, you can plot the stepped data and get a result like this:
The X axis contains the actual step value (in my case resistance running from 1 to 101 ohm) and the Y axis is the measurement result (in this case the energy when integrating over 1 second from the start.
Read up on the .meas
statement in the help, but the interface for it (place a .meas
on the sheet and right click it) is quite comprehensive.
Side note as you didn't understand what @winny meant with using @ in the plot environment:
If you enter V(n001)*I(R1) @ 1
instead of V(n001)*I(R1)
into the expression to plot, it will only show you the plot of that specific step. This is nice if you have a step which is doing extraordinary things and you want to inspect it closer and get less confused.
It does not allow you to integrate with the CTRL + Left Click functionality though.

- 17,464
- 1
- 32
- 59