I am studying electrical engineering and have an assignment which I have been working on for couple weeks, but can't solve.
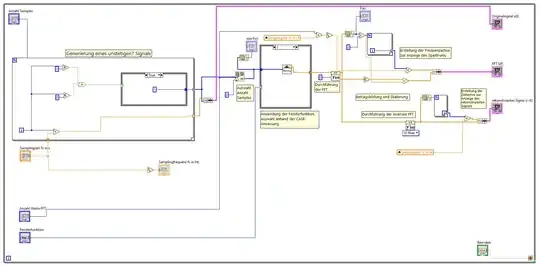
I have a discontinuous function as shown below and applied a FFT on it, which can be seen on the right.
On the bottom right corner is the inverse FFT plot in order to visualize the Gibb's effect, but I am not able to see it.
Why isn't the Gibb's effect showing up in this case?


