I have a shift register circuit that I want to simulate, and so far, everything seems to work as intended, but I am having a bit of a hard time with the voltage plots. They all overlap, and since the signals are all square waves with either 0V or 5V, it makes it hard to see all the plots at the same time. I have to delete one plot to see the other one, and I want them all shown, but on top of each other. Is there a way to shift the plot of the voltage at a specific signal up and down similar to how you can shift a signal on an oscilloscope up and down or perhaps have ltspice make say X amount of plots, all of them having the same horizontal axis, but each having their own vertical axis. In other words, I want the signals of different nodes to be shown on the oscilloscope in the picture and not overlapping, even though they have the same voltage
 .
.
Asked
Active
Viewed 1,037 times
1
Samuel Snerden
- 55
- 6
3 Answers
1
Instead of plotting v0, v1 etc, which is the easy to do default, plot the expressions v0, v1+offset1, v2+offset2 etc.
A simple graphical alternative is to put a voltage source in series with each output, and set them to different voltages.
Neil_UK
- 158,152
- 3
- 173
- 387
-
Thanks, this works. – Samuel Snerden Aug 26 '20 at 12:35
1
whenever I want to plot new trace in new window I would do the following

- Right click on the plot and click
Add Plot Plane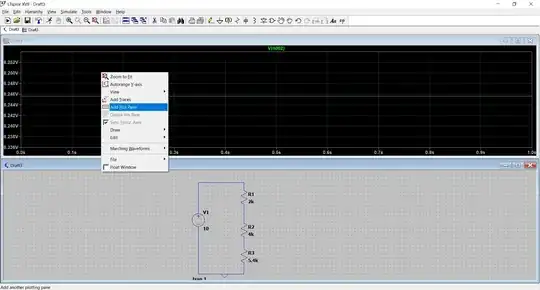
- This will add new plot plane. After clicking in the new plot plane that will be added, and selecting the node to be plotted, I will get the following result
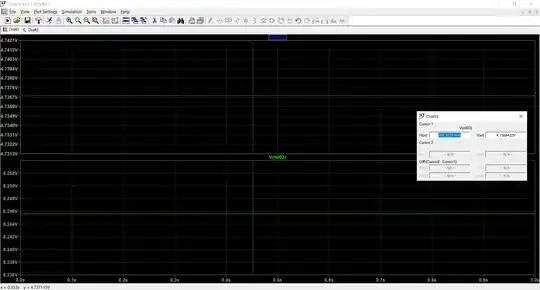
 Latter on, to analyze all the plots added, I will maximize the plot area to give me the results
 Notice that, the time axis has same scale and even the cursors lines goes over all the plot planes. Notice the dashed lines in the following image.


Sanmveg saini
- 561
- 2
- 12
-
Thanks, this is exactly what I was looking for. Can't believe it was this simple. – Samuel Snerden Aug 26 '20 at 12:54
0
Another option is to add a new plot pane: https://www.digikey.com/eewiki/display/Motley/LTspice+Tips+-+Plot+Manually+Entered+Functions
divB
- 1,312
- 14
- 32