4

I've learned that for a first order low pass filter (LPF) the 3 dB frequency is one where the amp's gain is (surprise) -3 dB below the DC gain. However, on a second order LPF that is underdamped we get a "peak" at around the cutoff frequency which seems to throw that simple definition off...

For example, take the following filter:

enter image description here

Which has the frequency response of:

$$ H(j\omega) = \frac{1}{1 + j\omega \frac{L}{R} -\omega ^2LC} $$

Running a Pspice simulation to calculate the cutoff frequency nets you the following result:

enter image description here

The gain at that frequency is a curious 6.6 dB. In contrast, for a resistor value of 500 ohms the system becomes critically damped and the cutoff frequency found by the simulation aligns with the simple definition I mentioned above.

How is the cutoff frequency defined in cases such as this? How does one go about justifying this simulation result, analytically calculating the above cutoff frequency?
Null
  • 7,448
  • 17
  • 36
  • 48

3 Answers3

3

The transfer function of this \$RLC\$ filter can be represented with a factored denominator featuring a quality factor \$Q\$ and a resonant frequency \$\omega_0\$: \$H(s)=\frac{1}{1+\frac{s}{\omega_0Q}+(\frac{s}{\omega_0})^2}\$. In this expression, \$\omega_0\$ represents the natural resonant frequency: it is the frequency at which the network rings for an infinite quality factor. It is also found under the term undamped resonant frequency. With this simple circuit built with perfect energy-storage elements (no losses in \$L\$ and \$C\$), it is classically defined as \$f_0=\frac{1}{2\pi L_2C_1}\$, \$L_2\$ being your inductor.

The peak you observe is due to the quality factor \$Q\$ defined by \$Q=R_1\sqrt{\frac{C_1}{L_2}}\$. Its value determines where the poles are located in the \$s\$-plane:

  1. \$Q\$ is less than 0.5: you have to real roots and the response to an input step is non-oscillatory. When \$Q\$ is much smaller than 0.5 (0.01 for instance), then the filter response can be approximated by two cascaded poles, one dominating the low-frequency response while the second is in high frequency. This is the low-\$Q\$ approximation you can look up in the Internet.
  2. \$Q=0.5\$, the roots are real and coincident: the response to a step input is fast and non ringing.
  3. \$Q\$ is more than 0.5 then the roots are conjugated and the response is a damped oscillatory waveform. The frequency of the oscillation is no longer the natural ones but depend on the damping ratio hence the term damped resonance frequency defined as \$\omega_d=\omega_0\sqrt{1-\zeta^2}\$. As \$Q\$ increases, the poles approach the imaginary axis and the response to a step input is less and less damped.
  4. \$Q\$ is infinite and the pole are located right in the imaginary axis and the response is a permanent oscillation tuned at \$\omega_0\$.

In your circuit, you can run a transient analysis and replace the ac stimulus by a PWL source delivering a 1-V pulse. If you observe the output voltage, then you'll either see a damped sluggish response for very low value of \$R_1\$, then set \$R_1\$ to 500 \$\Omega\$ and \$Q\$ is 0.5: the response is fast but still not ringing. Increase \$R_1\$ and you'll start seeing damped oscillations as \$Q\$ is getting higher.

The peak you measure in dB is directly the quality factor considering a 0-dB gain in this example. For instance, if \$R_1\$ is 2 k\$\Omega\$, the \$Q\$ is 2 or 6 dB.

Now the question was also about the -3dB-cutoff frequency. How do we obtain it from the transfer function? Simply derive the magnitude expression from the Laplace transfer function (replace \$s\$ by \$j\omega\$) by collecting real and imaginary parts. Then solve for the value of \$\omega_c\$ bringing the magnitude of the transfer function to 0.707: \$|H(\omega_c)|=\frac{1}{\sqrt{2}}\$. You can do it with the squared magnitude of the denominator equal to 2:

enter image description here

So for a load of 3 k\$\Omega\$ the -3-dB cutoff frequency is 24.2 kHz and it becomes 10.2 kHz for a 500-\$\Omega\$ load.

Addition:

Below the calculation sheet and the plotted transfer function where the 3-dB cutoff frequency is 24 kHz for a 3-k\$\Omega\$ load:

enter image description here

A quick SPICE simulation centered around the cutoff frequency confirms this number:

enter image description here

Verbal Kint
  • 20,420
  • 1
  • 16
  • 50
  • Thank you for your answer! However, I'm still a bit confused. What you've explained is indeed how I know one would find the cutoff frequency, and yet the result is different from the one found by the simulation (17.9kHz). Is the simulation just plain wrong? – Hitopopamus Apr 07 '20 at 10:47
  • With pleasure. I have added the simulation magnitude which confirms the cutoff point. In SPICE make sure you reduce the ac sweep to improve the vertical scale granularity at -3 dB. For instance no need to sweep up to the GHz with a cutoff frequency of 24 kHz and work with a vertical scale down to -160 dB if you want the -3-dB frequency. If you restrain the observation band between 100 Hz and 100 kHz as I did, it should do well. Let me know, there is no reason PSpice got it wrong : ) – Verbal Kint Apr 07 '20 at 12:04
1

Using a tool

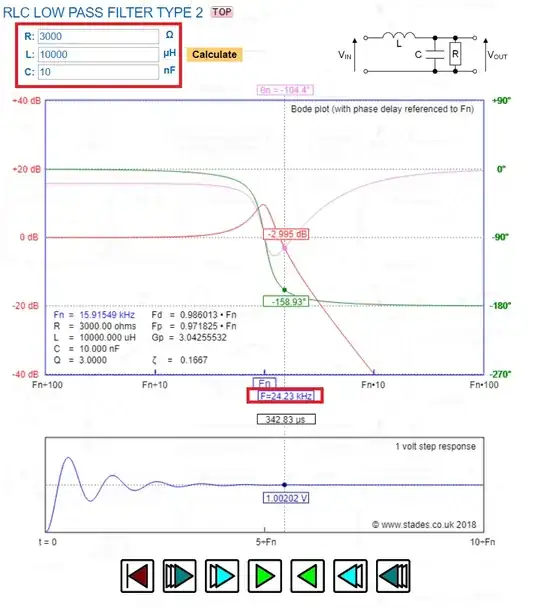
I get 24.23 kHz for the 3 dB frequency when R = 3000 ohms using this on-line tool: -

enter image description here

Other useful information: -

  • The peak amplitude is 9.665 dB (at 15.46 kHz) and not the 6.6 dB mentioned in the question. See \$G_P\$ = 3.04256 = 9.665 dB.
  • The peak occurs at 0.971825 of \$F_n\$ = 15.467 kHz
  • If a calculation is made for the natural resonant frequency you'd use this formula: -

$$f_n = \dfrac{1}{2\pi\sqrt{LC}}$$

  • if I plug 10 mH and 10 nF into the above I get 15.915 kHz (as calculated by the tool).

3 dB point

For a 2nd order low pass filter, the transfer function magnitude is this: -

$$|H(j\omega)| = \dfrac{1}{\sqrt{1 + \dfrac{\omega^2}{\omega_n^2}\cdot (4\zeta^2-2)+\dfrac{\omega^4}{\omega_n^4}}}$$

And, for the 3 dB frequency, the square of the denominator can be equated to 2 hence: -

$$2 = 1 + \dfrac{\omega^2}{\omega_n^2}\cdot (4\zeta^2-2)+\dfrac{\omega^4}{\omega_n^4}$$

If we let D = \$\dfrac{\omega^2}{\omega_n^2}\$ to make the math easier to follow we get: -

$$1 = D\cdot (4\zeta^2-2) + D^2$$

And solve for D we get: -

$$D = 1 - 2\zeta^2 ±2\sqrt{\zeta^4 - \zeta^2 + 0.5}$$

Or

$$\dfrac{\omega}{\omega_n} = \sqrt{1 - 2\zeta^2 ±2\sqrt{\zeta^4 - \zeta^2 + 0.5}}$$

So, if you know the Q of the circuit you can calculate \$\zeta\$ as \$\dfrac{1}{2Q}\$ and plug it into the above formula.

The example when R = 3000 produces a \$\zeta\$ of 0.1667 hence: -

$$\dfrac{\omega}{\omega_n} = \sqrt{1 - 2\times 0.1667^2 ±2\sqrt{0.1667^4 - 0.1667^2 + 0.5}}$$

$$ = \sqrt{0.9444 ± 2\sqrt{0.473}} = 1.523$$

And 1.523 multiplied by 15.915 kHz = 24.24 kHz i.e. precisely as expected.

Andy aka
  • 434,556
  • 28
  • 351
  • 777
  • The filter site you've built at http://stades.co.uk/index.html is nice-looking, congrats! I have realized a while ago that the peaking frequency in the Bode plot for the under-damped network was \$\omega_n\sqrt{1-2\zeta^2}\$ but if you run a transient response, the frequency of the response is actually \$\omega_n\sqrt{1-\zeta^2}\$. And I saw that you correctly calculated both frequencies in your site. Any intuitive or physical explanation why this is this way? The maths are ok and show this to be true but I was wondering if there is practical explanation. Thanks! – Verbal Kint Apr 07 '20 at 16:27
  • @VerbalKint thanks dude. The best I can say is that the peaking frequency in the f-domain for a LP filter is dragged slightly towards DC by the negative pole. As in you have to use both poles (in the old fashioned way) to ascertain amplitude at any point and because there is no zero at DC to block that negative pole effect you just get a slight reduction. Probably nothing you don't know BTW. Nothing springs to mind as "intuitive". – Andy aka Apr 07 '20 at 16:34
  • \$\omega_n\sqrt{1-\zeta^2}\$ corresponds with the pole position along the jw axis of course so there is some "intuition" here for the transient response. – Andy aka Apr 07 '20 at 16:37
  • @VerbalKint just in case you didn't quite understand what I was referring to when I said *in the old fashioned way*, I'm thinking of the pole zero diagram at the bottom of [my answer in this question](https://electronics.stackexchange.com/questions/316918/meaning-of-sigma-in-laplace-transform) where d1 and d2 both conspire to shape the bode plot but d2 drags the bode plot peak slightly south. If there was a DC zero (as in a bandpass filter) d2 would become cancelled by the effect of the zero at DC. – Andy aka Apr 07 '20 at 16:55
  • Thanks Andy. The reference to the poles makes sense but it is the \$\omega_n\sqrt{1-2\zeta^2}\$ that is the peak location on the Bode plot that does not have a real connection to the pole value and left me perplexed when I derived it : ) Cheers! – Verbal Kint Apr 07 '20 at 17:20
  • @VerbalKint if d1 and d2 are multiplied and the inverse taken, you get bode plot amplitude at whatever position on the jw axis you want. Then it should be a case of using simple trigonometry (it always gets more complex of course) to formulate the process. Then differentiate with respect to jw to get the position of maximum amplitude... blah blah blah but, is this a nice intuitive answer that opens a door to the soul? Probably not. – Andy aka Apr 07 '20 at 17:28
1

The other answers said enough, already, but I'll just add, for the sake of completion, that the -3dB point is usually considered as the half-power bandwidth, so it's generally considered as the point for fc. However, this makes more sense for monotonically non-increasing passbands, such as Butterworth, Bessel, Papoulis, or Halpern. Note that these last two have ripples, but they're non-increasing, unlike Chebyshev I. Where this condition is not met, fc is usually considered at the end of the ripples (though even this is just another convention).

But you can also determine fc from the phase response. In fact, this way can be safer, since the passband is really distorted, sometimes. Just look for the point where the phase is half the total phase shift. For a 2nd order, the total phase shift is 180o, so fc is when the phase is 90o. You'll discover that for your case, that's around the peak. Filters are weird.

a concerned citizen
  • 21,167
  • 1
  • 20
  • 40
  • fc (the 3dB point) is only at 90 degrees point when the filter has a Butterworth response i.e. zeta = 0.7071. In the above example when zeta = 0.1667, the phase angle is nearly 160 degrees at the 3 dB point. – Andy aka Apr 07 '20 at 14:28
  • @Andyaka Yes, but I meant that, if you look at the problem from the other way and consider fc to be when the phase is 90 deg, then fc would fall around the peak for OP's example. All this while considering the differences between monotonically non-increasing responses and the rest. – a concerned citizen Apr 07 '20 at 15:17