I'm responsible for maintaining a satellite that has an ADC that is failing in an unusual manner. Essentially what is happening is that it toggles back and forth between two values, if the raw voltage is in a certain range. I'm working on getting the raw counts, but the processed data looks something like this:
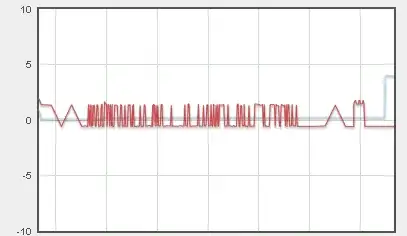
Note that the blue line means something else (Essentially, the software is trying to make the red line match the blue line).
Normally, the steps are quire small, as can be seen by the left few small bumps on the larger square wave. However, the steps are quite large once you drop below the value. While I don't have the raw count data, I do know it is reflected in the counts.
What I'm trying to understand is how this ADC is failing.
I'm guessing the following, but I would like to get some analysis of this idea:
- In the linear region, for each change in analog voltage in delta v, there is a change in counts of one.
- In the non-linear region, for a change in analog voltage in delta v, the jump in counts is much larger.
- It is possible that the delta v in 2 is larger than 1, but it is much smaller than would be normally predicted.
Remember, this is a satellite, so I can't bring it back to the lab for testing. Any thoughts?
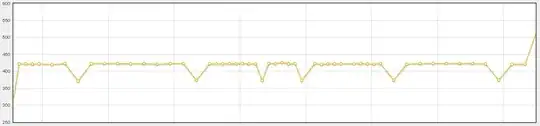
EDIT: Here is the raw counts for such an episode (sampled at a lower frequency). Also, the ADC is about 15-20 years old space rated, I don't have a part number on hand, but I'll see if I can get it. It was probably around in 1993, and might be FPGA based. The counts are as far as I can tell 374- 421 as the gap (Might be off by a few counts). Binary is as follows
374 101110110
421 110100101
Part of the reason that I think it might be the ADC is that there are multiple sensors with similar gaps. I'm working right now on better quantifying it, but here's an example plot. Note the points are the actual measured values, and the lines simply connect two of the same data point together. All of these values are read by the same ADC.
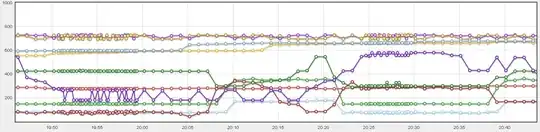
Furthermore, here is a list of every value read by the ADC over the period of about 24 hours. There are a multitude of lines (About 20 in all). I believe the gaps represent a dead zone in the ADC or related circuitry. The y axis in this plot is the ADC read output values. Anytime you see a largely vertical line seems to represent a region where the ADC cannot record a value.
The ADC is part ADC0808, the analog multiplexor is Part number is HCF4051BM1, at least from the schematics I can find... It's possible a change was made at some point in time.
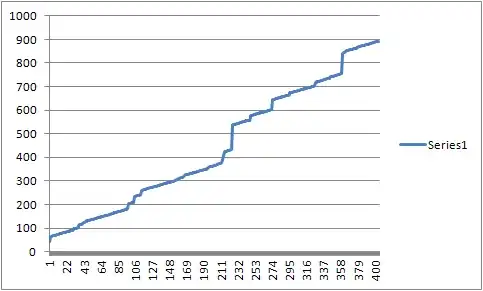
EDIT- More of an update: There are 3 analog multiplexors which feed into the ADC. I wanted to see if perhaps one of them was having this issue, where the others weren't. There isn't much evidence for that, however, see below. There are many gaps like this, I just chose to show one.
Count   #tot    #mux1   #mux2   #mux3
557 3360    1336    68  1956
558 252 128 4   120
577 684 292 4   388
578 964 480 8   476