1

EDIT: I've made adjustments based on your answers, while I couldn't get it to be evenly spaced, I managed to get a better curve with more samples per cycle. Turns out I need to remove the print function from my program so that the Pi could focus more on reading and plotting.

See ((Final adjustment)) at the bottom


Question:

Thanks for reading this. I'm doing a project using Raspberry Pi and MCP3208 (ADC) and currently, I'm testing my program with NI myDAQ's function generator to supply a 10Vpp to the ADC at 50Hz. I've tried using NumPy and managed to get some readings. However, when I got to my supervisor I noticed that my frequency reading is not exactly at 50Hz. Then I tried to change the input to 25Hz to see if it works at a lower frequency. Proceeding to 10Hz, I noticed that it is true! It is more accurate at a lower frequency.

My friend tried using another ADC chip and it worked accurately (or at least more accurate than mine) so I am wondering where did I go wrong with this? Below are my results and I've placed my code underneath.
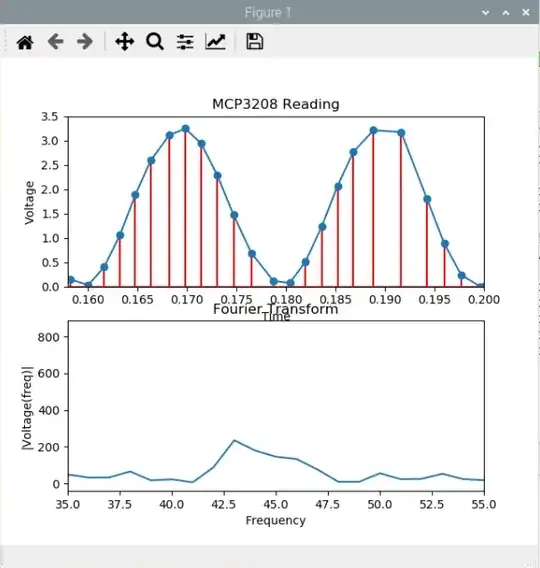
READING AT 50HZ

Reading at 50Hz

READING AT 10HZ

Reading at 10Hz


FINAL ADJUSTMENT

Reading at 50Hz

  • 1
    The more samples in a waveform you have OR the more exact that those samples fit the waveform cycle precisely, the better the outcome. You also appear to be missing samples: your 25 Hz screenshot is missing a sample at close to the far right position. There appear to be samples missing in your 50 Hz picture too. – Andy aka Mar 02 '20 at 16:15
  • 1
    You understand that the RPi is not an RTOS with hard-timing limits right? Your readings in Linux, especially if running X or GUI apps, can vary up to about 30ms (or more). – Ron Beyer Mar 02 '20 at 16:33
  • Measuring frequency very accurately is not at all as simple as it seems. Google “Bogdan Kasztenny Frequency”. I was looking at a couple of modern microprocessor relays this morning and they are using Clarke components to create a voltage waveform which they then use to time zero crossings. – relayman357 Mar 02 '20 at 16:46
  • @Andyaka from what I understand, the FFT is obtained from a reading that is beyond what I have shown in the diagram. I only made the window small so that I could count how many samples per cycle. I've updated the samples obtained in a larger window but I think you're right, I am missing samples. – Hazman Hussin Mar 02 '20 at 17:09
  • @RonBeyer my colleague managed to get a more accurate reading and she was reading at 100Hz. I've read multiple online posts and articles on raspberry pi limitation and came to the same conclusion but just wondering if I made a mistake here as my friend managed to get better results than mine. – Hazman Hussin Mar 02 '20 at 17:12
  • Hmm, your samples seem to be unevenly spaced. The FFT does not account for that if I'm not mistaken - it assumes it is time series data with even spacings.You do record the times you've taken the samples though, so you can try to resample the `ch0` buffer to make it even-stepped - using some form of interpolation. Then the FFT should be sharper and more precise. – anrieff Mar 02 '20 at 17:13
  • @relayman357 thank you, I'll take a look at it tho the article is long – Hazman Hussin Mar 02 '20 at 17:14

0 Answers0