4

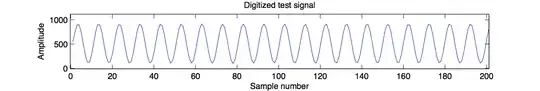
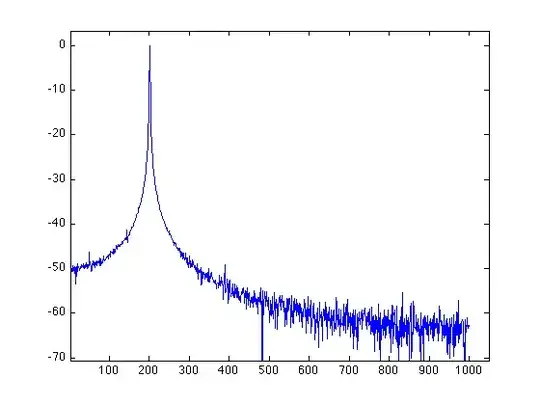
I have collected some samples for a 200Hz sine wave using an AVR microcontroller. I would like to quantify the performance of the ADC using the signal to noise ratio measurement. Theoretically, for an ideal ADC it should be SNR = 6.02N + 1.76 (dB). What could I do in MATLAB to see how this ADC compares to an ideal one?

enter image description here enter image description here

placeholder
  • 29,982
  • 10
  • 63
  • 110
Vanvan
  • 59
  • 1
  • 4

3 Answers3

1

That is only one type of measurement and it's not necessarily the best, but since you have the data ...

You need to plot the the Fourier domain data in a dB vs. frequency plot. - you need the magnitude data - be careful how you select your windowing for the FFT - you'll be able to see the noise floor vs. the peak (@ 200 Hz)

placeholder
  • 29,982
  • 10
  • 63
  • 110
  • I see a peak at 0db and the noise floor at ~ -50db. But the SNR is not 50dB is it? – Vanvan Oct 16 '12 at 08:26
  • Peak at 0dB suggests that you have normalised with the peak value. That would not be ideal if you are looking for an absolute measurement. – ARF Oct 16 '12 at 08:44
  • In that case yes, IF you've done it right. Please post the chart, the number of bits the ADC is supposed to have etc. This result won't get you the DR (Dynamic range) but it will get you the SNR - approximately. To get DR you'll need to increase the signal until it clips. – placeholder Oct 16 '12 at 09:47
  • http://i.imgur.com/zNgbi.png Do i read off the approximate SNR as 50dB? It's a 10-bit ADC. – Vanvan Oct 16 '12 at 17:15
  • Yes, it may be low because: 1) you aren't running a high enough signal so the noise floor is too high relative to the input (you don't mention the signal max swing either), 2) That formulae is for an idea case with sawtooth DNL, reality is often different; 3) it is that noisy. Please include the plot, experienced eyes will be able to tell you if you are doing things right. – placeholder Oct 16 '12 at 17:17
  • http://i.imgur.com/naL3d.png. That's my signal sampled at 2KHz. Basically, im working on an embedded system. In my report I want to show that the ADC is functioning correctly, and include some measure of performance. I was hoping to show that the SNR would be close to the theoretical value for a 10-bit ADC. – Vanvan Oct 16 '12 at 17:26
  • What windowing filter did you use for the FFT? the shape of the main carrier is off. You are seeing the effect of a finite sample length. The windowing suppresses that. However, I'm very rusty at the right choice here. – placeholder Oct 16 '12 at 17:33
  • You've only taken 200 samples, why not run 2000? That will help too. It looks to me that the SNR is better than 50 dB. At the top end it looks to be asymptotically approaching 60 dB but you can't know until the distortions are removed. – placeholder Oct 16 '12 at 17:39
1

Since the signal is at a known, precise frequency you can separate it from the quantization (and other) noise using a filter. The total power of the "clean" signal divided by the total power of whatever is left is the SNR. In Matlab, assuming you have your data in a vector called data and the time of each sample in t, you can do:

>> noise_portion = idealfilter(timeseries(data, t), [199, 201], 'stop');
>> signal_portion = idealfilter(timeseries(data, t), [199, 201], 'pass');
>> SNR_dB = 10*log10(sum(signal_portion.data.^2)/sum(noise_portion.data.^2))
Theran
  • 3,432
  • 1
  • 19
  • 21
  • It should be pointed out that this methods does not always work. It depends on the data used. Due to spectral leakage, the filter may not strip all of the signal from the data. In this case, the noise estimate may significantly over-estimate the true noise. - That being said, for most datasets it should not be a problem. – ARF Oct 16 '12 at 08:41
  • @Arik, keep in mind that any approach, including examining the DFT spectrum, is subject to leakage. That's why I made the pass band for the signal 2Hz wide. The exact frequency limits can be tweaked depending on how many samples we have, how accurate we think the frequency of the signal/ADC sampling is, etc. – Theran Oct 16 '12 at 17:36
0

The easiest approach would be to record the ADC signal with an open connection. calculating standard deviation an mean of the resulting data set will give you a good idea of the noise floor and offset of your converter.

If it is relevant to your case, you could then transform the dataset into Fourier space to estimate the noise spectrum. Beware: to get a good approximation of a noise spectrum you will need to average MANY noise spectra. You will know when you have enough when the average spectra does no longer change significantly.

Of course you could to the above with a range of (noiseless) DC values applied to get an idea if the noise is similar for the entire range of the converter.

More elaborate (quicker) noise sampling schemes exist but they are non-trivial to use.

ARF
  • 5,169
  • 9
  • 42
  • 69