1

A follow up question to my previous on building a DIY water gauge DIY water tank gauge using analogue ammeter.

I have scrabbled together a "Euro type" sender (10 Ω empty - 180 Ω full) and repaired the ammeter (which I need to keep). It has a resistance of 10 Ω and a full scale deflection at 6 mA (odd, I think, but it appears to have been adapted before).

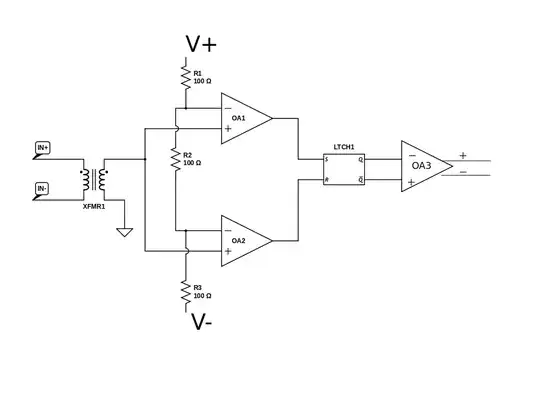
Using the help gained from my previous question I have designed this circuit:
schematic

simulate this circuit – Schematic created using CircuitLab

It has (as I understand all Wheatstone Bridges will) a non-linear response.

Graph of response

My question: what simple strategies can I employ to make the response as linear as possible?

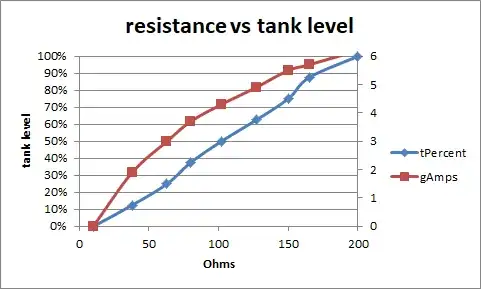
Edit: To add a graph of the sender's resistance vs tank level. These are actual measurements taken on the bench.

resistance vs tank level

Edit: And an additional graph showing (I think) the discrepancy between actual level and the gaugeAmps.
enter image description here

  • 1
    You're right, it's not linear. But: do you *really* care about the nonlinearity? I.e. is your R3 even accurate enough, and all your resistors temperature-regulated/compensated enough, your ammeter precise enough for this to make a difference? Do you really need to know the fill of your water tank more precisely than what your nonlinear curve (falsely) claims? I mean, this is on a *boat* which *rocks* and tends to be slanted depending on load... – Marcus Müller Jan 02 '19 at 18:08
  • And you're right, of course. In earlier designs the curve was heinous, but more by luck than judgement I have reduced it to a purpose serving point. I am just perhaps curious to know what method might be used, if any, to improve things further. – Lance Kneeshaw Jan 02 '19 at 20:07
  • I see the numbers have changed a bit since I answered the previous question. Can you create another graph of resistance versus tank level? 0% = x Ω, 10% = y Ω, etc. – Transistor Jan 02 '19 at 20:21
  • @Transistor - thanks for your continued interest. BTW I appreciated your suggestion of a LED to stabilise the volts and only eliminated it in my search to flatten the curve. – Lance Kneeshaw Jan 03 '19 at 09:09
  • I noticed you had removed the LED and wondered if that was to your detriment. Thanks for the additional info. The level/resistance response looks quite linear. I'll have a look at it tonight. – Transistor Jan 03 '19 at 09:56

1 Answers1

2

The usual way to correct the curves is to introduce a non-linear element, such as a diode. For example, diodes conduct practically zero current if the voltage is less than Vf (0.3V - 0.6V typical). So putting a diode and a resistor in parallel to one of the existing resistors would cause resistance to decrease once voltage reaches 0.6 volts.

Unfortunately, this method is not be applicable to your device, as your meter sees 0.06 volt drop, and no semiconductor has Vf that low.

If you really had to do this, I'd suggest using opamps to amplify the signals so they are in range for diode correctors, or just going straight to MCU. But this is probably going to be an overkill for your application, so instead, I think having a custom non-linear scale on the meter would be the easiest solution: custom non-linear scale

theamk
  • 3,128
  • 11
  • 15