1

I don't have an electrical engineering background but a neuroscience one, so apologies in advance for my poor knowledge.

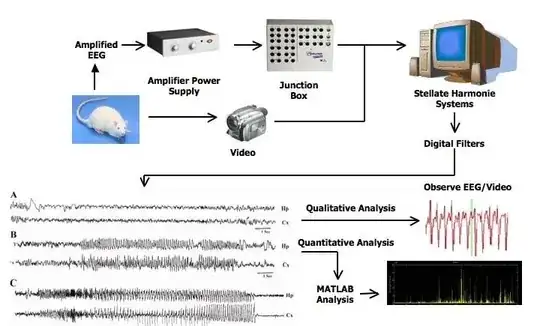
Basically I have an EEG machine (Stellate Harmonie) and I would like to be able to read the data in real time. Unfortunately it saves the EEG output as a .sig file and the app itself is clunky and does not conduce itself to doing so. I am working with software engineers that code in python that are ready to work on it but can't until we can figure out a way to read the output of the machine in real-time. Any method to be able to figure this out would be greatly appreciated!

Edit: looking for a manual, but found this meanwhile, the image of the setup is here: http://userfile.alephnetwork.com/files/b2gmarekt_vendor/Stellate%20Harmonie%20%20E%20.pdf
user195672
  • 11
  • 2
  • 1
    How the machine is connected to the computer? – Eugene Sh. Aug 10 '18 at 19:44
  • 1
    Welcome to EE.SE. You haven't provided a link to the machine's user manual or any clue as to what interfaces are available on the EEG. – Transistor Aug 10 '18 at 19:44
  • Hey Eugene: on page 8 of the document there's an image of the whole set up of the machine: http://userfile.alephnetwork.com/files/b2gmarekt_vendor/Stellate%20Harmonie%20%20E%20.pdf Does this help? @Transistor: I'm currently trying to find the manual, but I have linked what I could find – user195672 Aug 10 '18 at 20:13
  • 1
    Python is not a very fast/efficient language. You might need some C programmers if you need real-time processing. – Oldfart Aug 11 '18 at 06:49

1 Answers1

1

You may not be able to get the processed results in analog form but the inputs seem to interface between a junction box the Harmonie-E box. slow download Quick REf Guide

(If you are trying read from program memory in real-time you need a lot more insight) Why not deal with the factory support?

enter image description here

• Compressed spectral arrays for up to 128 channels without interrupting real-time recording
• Spectra and band activity for up to eight user-defined bands
• Coherence and phase spectra to measure relationships between two channels over time
• Spectral activity map. Display up to eight topographical representations simultaneously
• Long-term trend displays of band activity, ten plots at a time

Tony Stewart EE75
  • 1
  • 3
  • 54
  • 182