11

How do I debug (source code single step) a Arduino Uno with gdb on a Linux pc? Please note that I do not like to use AVR Studio in wine or VirtualBox.

Question 1: Physical connection

How and what do I connect to the Uno board? My guess is that since the Uno board is populated with a ATmega328, single step source code should be available? I also guess that I can use either a AVR JTAGICE mkII or a AVR Dragon over the ICSP header?

Question 2: GDB server

Then I noticed that there is some projects like AVaRICE that seems to provide a jtag to gdb function, but there may be other projects?

Question 3: Where is the elf?

And if I get it up and running, where does the Arduino IDE hide the generated output like the elf file with debug symbols (there should be one)? Or do I need to generate a classic Makefile that just uses the Ardino libs?

I tried to find some info on what/how to use, but I have only found those clues that told me what I could do. Can someone push me in the right direction?
Johan
  • 2,385
  • 2
  • 25
  • 27

3 Answers3

3

Simavr AVR processor simulator now provides a good GDB server for AVR firmvare debugging, including Arduino. You can use it by its own (requires you to write a small console application for your particular hardware configuration) or from within Simutron GUI environment, where you can define your hardware configuration via schematic capture.

Note: with these tools you don't have a physical connection as all hardware is simulated.

hovercraft
  • 31
  • 4
3

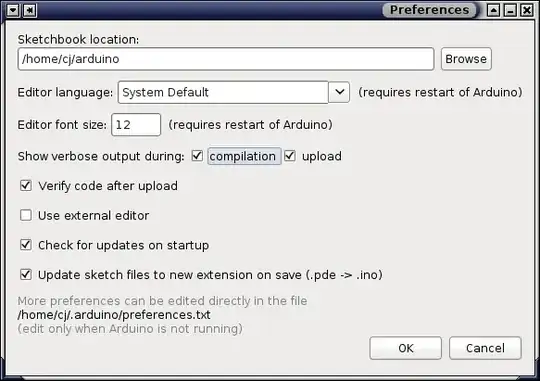
You can find the compiler artifacts by holding down the shift key when clicking the compile button in older version of the IDE (read < 1.0). In newer versions (read >= 1.0) there's an option under the preferences dialog for displaying verbose output during compilation (see screenshot). With verbose output the folder where all the compiler outputs end up is printed (repeatedly) in the console. That should get you started at least.

screenshot arduino show verbose output during compilation

On a side note, there was all sorts of chatter on this subject on Arduino developers list earlier in June 2012 and somebody posted an announcement to the Arduino developers list on an improved / integrated way of GDB debugging for Arduino, but I haven't investigated it much further. I guess the project is called VisualMicro (?). It looks like it's been built as a Visual Studio plugin so might not be helpful to you in a linux environment, and it's in beta on top of that, but I'll let you decide.

Johan
  • 2,385
  • 2
  • 25
  • 27
vicatcu
  • 22,499
  • 13
  • 79
  • 155
  • I enabled the "Enable verbose output during compilation" and they use something like /tmp/build3652385594823436592.tmp/ as their build dir, also the elf was built with the -g flag so it should contain the debug symbols. That means that I have found the build artifacts, now I just need to get the jtag to work. – Johan Jun 16 '12 at 07:42
2

This is answered in a linux journal article referenced in a similar question: Jtag debugging AVR.

Basically, using avr-gdb and simulavr in tandem, you can run your software on a choice of AVR microcontrollers through the simulator, while using GDB to step through and observe the executing code.

Hope this helps!

slurms
  • 247
  • 1
  • 3
  • 11