1

This is a popular software for those people who don't have a real oscilloscope or function generator: https://www.zeitnitz.eu/scope_en

If anyone tried it before, would you answer my questions, please?

1.What is x-y graph? What does each axis represent?

  1. How Can I measure the frequency of a signal that is composed of two frequencies? such as: resonant frequency or harmonics.

Thank you very much,

Michael George
  • 3,742
  • 13
  • 53
  • 84

2 Answers2

5

What is x-y graph? What does each axis represent?

XY mode is used when you have two inputs (channel 1 and channel 2) and you want to represent the phase relationship between them differently: -

enter image description here

Typical is when Y lags X by 90 degrees and is the same frequency - it produces a circle as per the top line above. Channel 1 normally drives the Y axis and channel 2 drives the X axis.

This function is available on most o-scopes.

How Can I measure the frequency of a signal that is composed of two frequencies? such as: resonant frequency or harmonics.

It's tricky with a normal scope and I'd tend to use a spectrum analyser for this if accuracy is required. Having said that, if the input is a waveform that is harmonic rich then a scope can be used to fairly accurately determine the fundamental frequency - think of a square wave - it contains an infinite series of harmonics but nobody has much problem determining the fundamental frequency: -

enter image description here

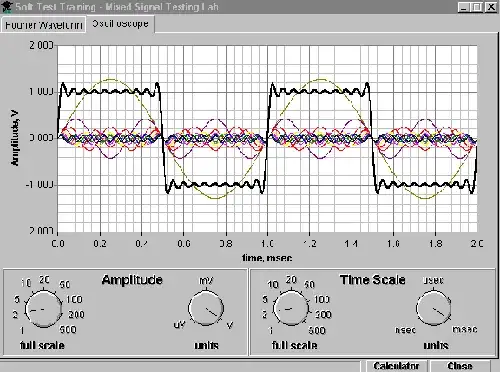
The square wave above (black) is running at 1 kHz because the timebase is 1 milliseconds for each cycle. Having said all that it appears that the sound card software in the question has this feature: -

Frequency analysis (Fourier spectrum)

Andy aka
  • 434,556
  • 28
  • 351
  • 777
1

To answer your question on X-Y mode (which is an independent question in its own right):

For a scope, the X (horizontal axis) is normally time, and the Y (vertical axis) is normally voltage (for the purists, amplitude as it may be current with the appropriate probe).

In X-Y mode, 2 signals are applied and the X axis is no longer time, but the amplitude of (usually) channel 1, and the Y axis is now the amplitude of channel 2.

This gives rise to a Lissajous figure whch can effectively show complex relationships between 2 signals such as harmonics and phase.

Video tutorial

Update: Added a common use:

X-Y mode is commonly used in Analog signature analysis on Flying probe test stations.

Peter Smith
  • 21,923
  • 1
  • 29
  • 64