-1

I know that the relationship between the base current \$i_B\$ and the base-emitter voltage \$v_{BE}\$ is given by the Shockley equation.

\$i_B = I_S (e^{v_{BE} / V_T} - 1)\$

This is the input characteristic and it looks like this. enter image description here
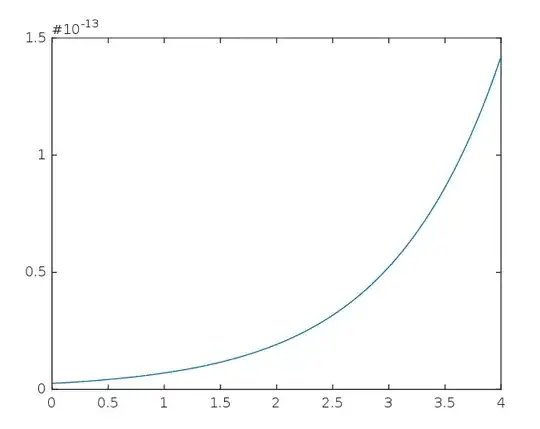
But what is the equation used to produce the collector current \$i_C\$ versus collector-base voltage \$v_{CE}\$ characteristic plots for npn BJTs?

For an n-channel MOSFET, you typically are provided with the three regions (cutoff, triode, and saturation) along with their respective equations, so you can generate the characteristic curves pretty simply.

Here are the npn characteristic curves I'd like to generate with MATLAB, for example.

enter image description here

Thanks in advance.

Ricardo
  • 6,134
  • 19
  • 52
  • 85
QuickAnswers
  • 29
  • 1
  • 1
  • 7
    -1 without even reading. We do engineering here where quantities are always labeled. Apparently some sloppy professors let you get away with drawing graphs without labels, but here in the real world we'll downvote, vote to close, and otherwise dismiss anything you attempt to say. Such gross disregard for basics is irresponsible and a affront to all the real engineers you expect to donate their free time to read and answer your question. *Screw this!* – Olin Lathrop Dec 22 '15 at 12:11
  • 4
    Okay, I screwed up. I should have labeled it and said it was \$i_B\$ versus \$v_{BE}\$ more explicitly. That said, chill with the melodramatic attitude. You have enough time to "zing" me and to downvote me, but not to look it over? Riiiight. – QuickAnswers Dec 22 '15 at 15:19
  • 3
    Simply labeling the axes Ib and Vbe isn't good enough. The units need to be there too, and I have not idea what the #10e-13 is supposed to be telling me. Instead of writing a comment arguing, you could have fixed it. Now it's still wrong. You try to make it sound like this is a minor thing and it's somehow OK. It's not OK. There is no place for this nonsense in engineering. -1 again if I could. – Olin Lathrop Dec 22 '15 at 16:09
  • 1
    That graph isn't even the one that's relevant or important. I just meant to illustrate that I knew how the input characteristics (base current versus base-emitter voltage). It's the output characteristics -- those at the bottom, that are relevant. Keep railing on. You're useless to me anyway, old man. – QuickAnswers Dec 22 '15 at 17:31
  • Graph labels aside, I have no idea what you're asking in your actual question "iC versus collector-base voltage \$v_{CE}$" VCE is the collector-emitter voltage. You'll probalby want to read up on the Ebers-Moll and Gummel-Poon BJT models (in this order). Based on your 2nd graph it seems you want vs VCE after all. – Fizz Dec 23 '15 at 00:38
  • 5
    I wouldn't be so dismissive of Olin. Chances are he'll end up answering a few questions if you post a lot of them. He's given a tremendous amount of great advice on this site. – Keegan Jay Dec 23 '15 at 01:50

2 Answers2

2

If you want that 2nd graph, particularly with slopes in the active region modulating hfe, which is called the Early effect, you need the Gummel-Poon BJT model. It is covered in detail in most solid state device textbooks. It looks like it's already implemented in matlab: http://www.mathworks.com/help/physmod/elec/ref/spicenpn.html

Also if you don't need the Early effect (or high-level injection), then Ebers-Moll model is all you need. Look at these slides pp. 22-25 for instace for a scilab implementation of the equation[s], which I'm sure you can easily translate to matlab. Any microelectronics textbook usually covers Ebers-Moll.

Fizz
  • 14,355
  • 2
  • 43
  • 97
1

The most useful and informative information can be had by actually measuring the data and plotting the curves from such data. This way you can get the behavior of the specific semiconductor that you have in hand. You can also then understand how the measured data changes with other influences such as temperature variation.

There are testing devices that can plot a family of characteristic curves right onto an oscilloscope screen. These can be very handy for comparing transistors and getting a quick measure of the transistor parameters. These do require you to read your data points off the scope screen and may not be as accurate as some other type of setup where voltages and currents are measured using digital measurement devices in the test setup.

Michael Karas
  • 56,889
  • 3
  • 70
  • 138
  • Hey, thanks for the response. Yeah, that's true that you can plot this from measurement, but since I often see plots like this in textbooks and online, in a theoretical context, I am wondering what equations they use to draw them. – QuickAnswers Dec 22 '15 at 15:20
  • The BJT is a strong non-linear device - in particular the Ic=f(VCE) characteristics. In those cases, you cannot always expect a simple formula that is able to reflect the physical properties of such a device. – LvW Dec 23 '15 at 10:37