What is the process of obtaining the poles and zeros from frequency response plot or data. Any reference or Matlab code will be great help
-
Going left to right (low to high freqeuncy), poles are where the response bends down 20 dB/decade (= 3 dB/octave) more, and zeros are where it bends up 3 dB/octave more. – Olin Lathrop Feb 05 '15 at 14:58
-
make that 6dB/octave... – Feb 05 '15 at 15:03
-
What Olin said, and if it falls off faster than 6dB/ octave then there is more than one pole in the vicinity. – George Herold Feb 05 '15 at 15:12
-
@Olin: not really that easy, because you can have both poles and zeros at the same time canceling each other => 0dB/decade – HKOB Feb 05 '15 at 16:39
-
@HKOB: If the pole and zero are really on top of each other, then you *can* ignore both of them for practical purposes. Basically, you have a low pass (pole) and high pass (zero) filter cancelling each other out. – Olin Lathrop Feb 05 '15 at 16:54
-
@Brian: Oops, I meant to say 6 dB/octave. Unfortunately it's been too long and the system won't let me go back and edit the comment anymore. – Olin Lathrop Feb 05 '15 at 16:55
2 Answers
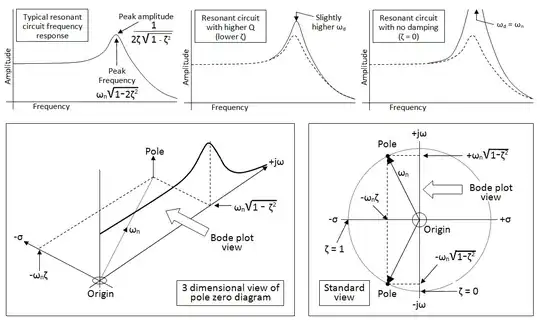
There is a little uncertainty in my mind what the OP is asking for so I'll try and generalize a little. Look at the drawing below (top half) - it shows three examples of bode plots for 2nd order systems where damping has a few values: -
Below the three bode plots are examples of the pole zero diagram and how it relates to the bode plot. Mathematically they are very connected (see the formulas) and, for pure 2nd order systems, it should be a fairly easy task to convert the bode plot into a fairly precise pole-zero diagram. However, for quite small subtleties in the bode plot there can be a much wider range of poles and zeroes especially if you include higher orders than two.
What I'm trying to say is that it can be quite difficult/imprecise going from bode to pole zero diagrams but not the other way round.
- 434,556
- 28
- 351
- 777
I presume with frequency response plot or data you are speaking about Bode plots. As I see you're hinting for a Matlab oriented solution, I suggest you to explore Matlab's System Identification toolbox.
With this toolbox, you can treat input(s)/output(s) data from your process in order to obtain structured models out of them. By playing with the structure, which is something Matlab doesn't dare to guess, you can find models that match well your original input/output behaviour.
A particularly useful function in my opinion is ssest (state-space estimation), which estimates for you numerically a state-space system of order n out of the frequency domain data you gather.
- 415
- 4
- 16
