What software do you suggest for visualizing sensor data on OSX. For example bunch of sensors connected to Arduino and sent to MacBook via serial. Realtime graphing preferred but would be interested also in log-and-graph-later solutions.
Asked
Active
Viewed 4,166 times
9
-
1I'm also interested in solutions for this, particularly open source/cross-platform. For quick, one off graphs to help me visualize the data I tend to use gnuplot. But these graphs are quite ugly and as far as I know, gnuplot doesn't support real-time. You'll likely end up having to use some libraries to build your own. For example: http://eli.thegreenplace.net/2008/08/01/matplotlib-with-wxpython-guis/ – David Brenner Dec 21 '09 at 19:42
10 Answers
7
One that comes to mind is Processing. The development environment is similar to the Arduino's and it is cross platform (Java).
I would like to see a native OSX app but haven't found it yet :)
jdiaz
- 1,933
- 4
- 21
- 20
5
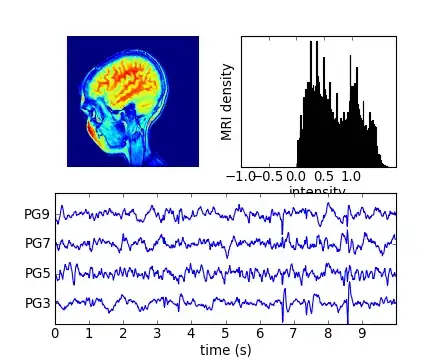
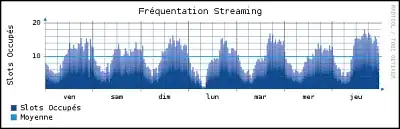
I use either RRD TOOL which is good for monitoring of continuous streams of data. When I want to produce one off graphs I usually go with matplotlib.
-
1How did you get RRDtool installed? Did you compile RRDtool and its dependencies from source, use fink/homebrew/etc, or find pre-compiled binaries? – Clinton Blackmore Jan 01 '10 at 15:07
-
http://brew.sh/ should work very well for you for most popular oSS packages. – akohlsmith Aug 18 '13 at 03:38
4
You can use Grapher for simple graphs. It comes with OSX. Although it's not really powerful, it's ok to take a quick look at some samples.
@zklapow do you have a link?
tinkerlog
- 157
- 3
3
Python is both open source and cross-platform. You can use pyserial to connect to an Arduino and there are libraries available to graph the data.
Greenonline
- 2,064
- 7
- 23
- 38
zklapow
- 1,551
- 16
- 17
3
I use Max for all my sensor processing and visualizing. Both Max and its younger open source sibling Pd have libraries for advanced graphics programming (Jitter and GEM respectively). Jitter is its own graphics system based on 'jitter matrices', but includes a suite of OpenGL based tools. GEM is based on OpenGL.
An alternative (again OpenGL-based) dataflow language that comes with OSX is Quartz Composer.
Along with Processing, vvvv, and Flash these are the standard realtime video programming environments for artists. All great choices for rapidly developing sensor data visualization applications.
terrace
- 1,334
- 1
- 15
- 28
2
You can have a look at my Processing based sketch, I used for visualizing AD7746 data. It is very simple - but perhaps just the thing you need. It takes values from the serial püorts, decodes strings and generates data sets. Just contact me if you have questions.
Interactive Matter
- 221
- 1
- 2
1
I will suggest using some RIA framework (http://en.wikipedia.org/wiki/Rich_Internet_application). Strictly speaking I recommend Data Visualization framework on top of RIA framework (http://www.insideria.com/2009/12/28-rich-data-visualization-too.html).
I think the best approach will be Flash. I suggest Flex or Air (if You need more desktop integration).
To connect with flash You need ser2net or something like this. Fore example You can use as3glu (http://code.google.com/p/as3glue/) that hes ser2net build in.
Another interesting project is NETLab Toolkit (http://newecologyofthings.wik.is/NETLab_Toolkit)
Maciek Sawicki
- 810
- 1
- 9
- 13
1
I would use a database (like PostgreSQL) and a web interface. Run Apache and serve up graphs and tables. Any device with a browser could view the graphs, tables or raw data.
You could also provide a query interface to the data.
Daniel Grillo
- 7,659
- 18
- 51
- 69
jluciani
- 11,646
- 1
- 34
- 54
0
When I need something better than the grapher built into the Arduino IDE, I use sebnil/RealtimePlotter, which I run from within Processing. There are three versions of the sketch, and it takes up to 6 channels input by default (although this can be changed).
You might be able to export it an a standalone, but apparently there is/was an issue with that. I haven't tried it myself.
Greenonline
- 2,064
- 7
- 23
- 38