0

Image got from a digital oscilloscope 
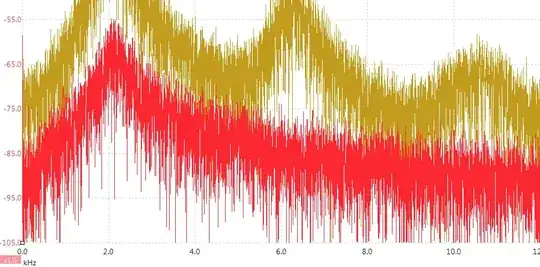
Only the red channel is in consideration. The yellow curve is not relevant, which is only another channel of the oscilloscope.

The image above was captured from a digital oscilloscope. The vertical axis is in dBu, which can be converted in to Volts. And the horizontal axis is in kHz frequency, with a frequency resolution of 1.2Hz.

Assuming all the data of frequency vs voltage at every single frequency could be obtained, Could I ask:

  • How to calculate the RMS value of the noises with bandwidth from 0Hz to 3.6Hz(only three points)?
  • how to calculate the RMS value of the noises with bandwidth from say DC to 10kHz?

EDIT

One answer mentioned that the more points exist in a given bandwidth, the lower the voltage level will be. However this is not the case according to experiments.

The signal source is not connected with anything, which means leaving the oscilloscope unconnected.

Picture 1 shows acquisition time of 8.192s, indicating a frequency resolution of 0.12Hz. Picture 2 shows acquisition time of 26us, indicating a frequency resolution of 38kHz. However the noise floors for these two diagrams are the same at -105dBu.

Time gate 8.192s Time gate 26.21us


EDIT 2 2015-03-21

For the above two diagrams, the noises floor are similar. It is because for the above two cases, the noises come from quantization noise of the ADC of the scope.

The TOTAL noise power of the quantization noises are always the same between 0 - 0.5*fs(from zero to half of the sampling frequency), no matter what the fs is.

richieqianle
  • 1,612
  • 3
  • 24
  • 44

2 Answers2

1

If you have a single frequency spectral point at say 2kHz and it is -55 dBu then it has a voltage level of 0.001377449 Vrms (see this for the conversion). If you also had another spectral point at 2.1kHz and it was -60 dBu (0.000774597 Vrms), then you'd calculate the RMS value of these two points by this: -

RMS Value of A and B together = \$\sqrt{A^2 + B^2}\$

You'd get a value of 0.001580305. That's two points.

Now extend this method to all the points within the spectral band of interest. If it means summing 10,000 points then taking the sq root of this sum, then that's what you have to do.

Andy aka
  • 434,556
  • 28
  • 351
  • 777
  • Thanks for your answer. The frequency resolution is 1.2Hz. From 2kHz to 2.1kHz there will be around 80 points. However, are you sure about the calculation? If this is the case, the more points(better frequency resolution, longer time), the noises will be larger, which could not be true. – richieqianle Jun 09 '14 at 14:31
  • The more points you have in a given bandwidth the lower the noise will be per point. Therefore it roughly works out the same. – Andy aka Jun 09 '14 at 14:37
  • The shape should be consistent I wonder, since the FFT result presents a continuous frequency domain. Is that correct? – richieqianle Jun 09 '14 at 14:39
  • @richieqianle I don't understand your question. – Andy aka Jun 09 '14 at 14:48
  • @Andyaka Only part way there, if summing over all the points the answer is sqrt ( delta_f* SUM(value^2)) instead of the sqrt(SUM(value^2)) you have above. – placeholder Jun 09 '14 at 15:50
  • @placeholder - I think I know where you are coming from but if you have the RMS values for each slice of spectra, surely it's how I wrote it - are you assuming each Y-value is noise/sqroot(Hz)? – Andy aka Jun 09 '14 at 16:34
  • I have done some experiments and updated the results, could you have a check? – richieqianle Jun 16 '14 at 05:11
  • @richieqianle what specifically do you want me to check? – Andy aka Jun 16 '14 at 07:49
  • @richieqianle OK I see what you're saying but if the sample time for the 2nd run was the same as the first run then you'd see the difference. The 2nd run is just the tiniest snapshot of the measurement taken on the first run - wait longer and noise gets bigger for a given fixed bandwidth. – Andy aka Jun 16 '14 at 08:08
  • "wait longer and noise gets bigger for a given fixed bandwidth".. Sorry I could not understand this.. Could you please illustrate a bit? – richieqianle Jun 16 '14 at 08:51
  • Noise is random, if you wait long enough it will attain a value of infinity. If you sample noise over a very short time period its RMS value will be much less than if sampled over a longer time period. This applies to the scope signal and the FFT bins. – Andy aka Jun 16 '14 at 09:10
  • @Andyaka Sorry I did not get the point... I thought RMS value of signals does not depend on time, isnt it correct? – richieqianle Jun 18 '14 at 02:19
0

The reason why your two figure has same noise floor is becasue you confuse SNR & FFT noise floor, they are different. They have the same samples, so their FFT noise floor are the same

Here is the official explanation of SNR, FFT Noise floor from ADI https://www.analog.com/media/en/training-seminars/tutorials/MT-001.pdf