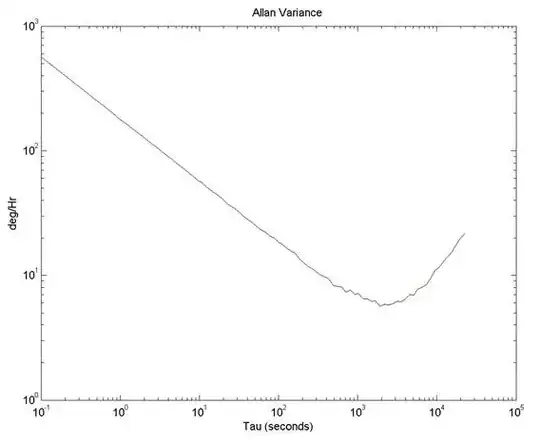
In your first figure, the root AV curve appears to follow a slope of \$-0.5\$ from the start of the curve and all the way up to an integration time of a few hundred s. A simple way to extract angular random walk (ARW) is to make a straight line through the part of your curve with slope of \$-0.5\$ and find where this line crosses \$\tau = 1\$s. In some cases this line will not follow your AV curve when it crosses \$\tau = 1\$s, but in your case it does. (Which means white noise is dominating for integration times less than a few hundred seconds). In your case it seems you have already found that the curve crosses \$\tau = 1\$s at \$178.182^{\circ}\$/h. This means that your ARW = \$178.182 / 60^{\circ}/\sqrt{h} = 2.97^{\circ}/\sqrt{h}\$.
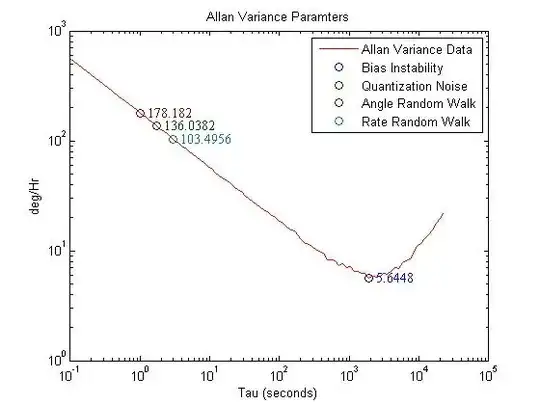
The quantization noise seems not to influence your root AV curve at all. (I can see no part with slope of -1). Thus it seems negligible. Perhaps you use a very high resolution ADC to sample the gyro data or you decimate the data before you perform your AV calculations? I've never worked with the quantization noise, but I suppose you would do it the same way as with ARW; i.e. you find the part of the curve with slope of -1, if neccessary extend this with a straight line so it passes \$\tau = 3^{0.5}\$ seconds, and convert to proper units.
The same goes for rate random walk. Don't read the value of the curve itself at \$\tau = 3\$ seconds, but draw a straight line through the part of the curve with slope of +0.5, extend this line all the way to \$\tau = 3\$ seconds, read the value and convert to proper units.
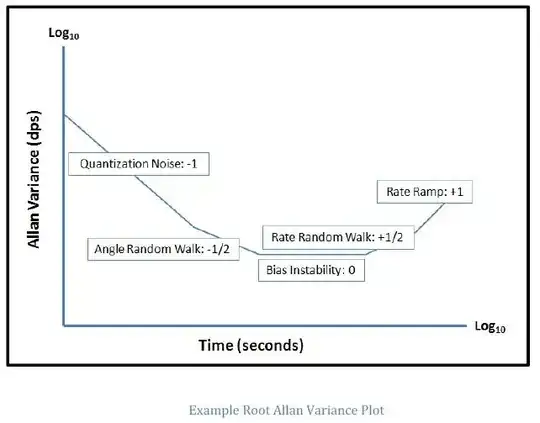
As for bias instability, I believe it requires that you actually have a part of the root AV curve which is actually flat (i.e. slope of 0) as shown in your 3rd and 4th figure. The bias instability is then simply the level of the flat part of the curve. (No further conversion needed). This would be the part of the curve where further integrating the rate signal (i.e. longer integrating time) would no longer increase the accuracy of your reading. (White noise (ARW) drops when you average over longer time periods, flicker noise (bias instability) does not drop when you average over longer time periods).